F1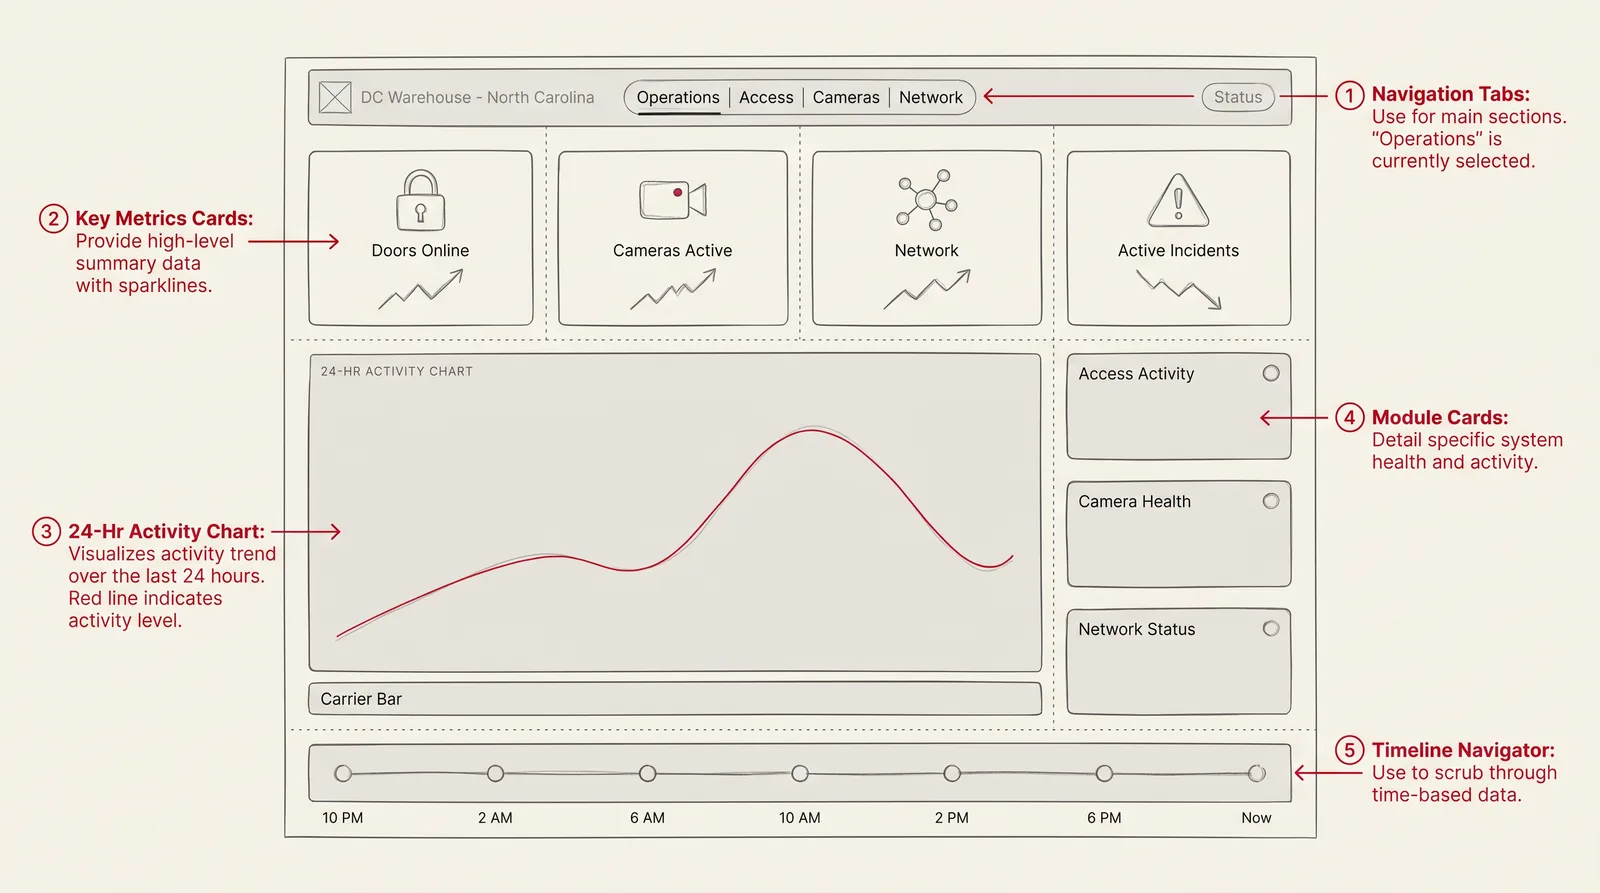
F1 · Frame
Command Center Overview
A high-level operations screen showing door status, camera health, alerts, switch status, and active incidents.
Introducing Orbyte, a full platform built to help businesses scale and launch custom AI automations.
Enterprise Product Design Case Study
Centralizing cameras, access control, network diagnostics, and audit intelligence into one operational command center.
A custom dashboard designed to help security, IT, and access control teams monitor door events, camera health, network status, IP assignments, route traces, switch conditions, and audit logs from one organized interface.
Role
Product Designer / Systems Builder
Focus
Enterprise dashboard UX, security operations, monitoring, audit workflows
Platform
Custom web dashboard
Systems
Cameras, access control, cloud APIs, SQL data, network monitoring
Status
Enterprise operational dashboard
Enterprise Security
tellbyte
× Chick-fil-A
Why this project matters
Large enterprise campuses often rely on several disconnected systems to manage security operations. Cameras, access control, door events, network devices, IP assignments, logs, and audit reports can live in separate tools. This dashboard was designed to bring those operational signals into one organized interface so teams could monitor, investigate, and act with more clarity.
Security teams need to understand what is happening across doors, cameras, switches, and networked devices without jumping between disconnected systems.
When a door event, camera issue, forced entry alert, or network failure occurs, teams need context quickly so they can decide what action to take.
Enterprise environments need clean logs, searchable history, event trails, and exportable records for investigation and compliance workflows.
User and use case
Primary Users
User goal
Monitor access control and camera infrastructure, diagnose operational issues, review security events, verify system health, and export clean records for investigation.
Pain Points
Design principle
The interface should make operational status visible, preserve context during investigation, and make high-impact actions clear, controlled, and auditable.
The core workflow
The workflow was designed to help operators move from signal to context to action without losing visibility across the larger security environment.
UX challenge
Problem statement
Security and access control systems generate a high volume of events, device statuses, logs, and network signals. When these signals are scattered across separate tools, operators lose time and confidence trying to understand what happened, where it happened, and what needs to be done.
Design goal
Create one dashboard that helps users answer:
“High-trust dashboards should not only show system data. They should help operators understand the situation, verify context, and act with confidence.”
Wireframe story
Drag through the five wireframe frames that defined the operational flow: overview → doors → cameras → network → audit.
F1 · Frame
A high-level operations screen showing door status, camera health, alerts, switch status, and active incidents.

F2 · Frame
A door-focused view for lock state, forced entry events, access denied logs, user events, and event history.

F3 · Frame
A review screen connecting camera status and event details so operators can investigate issues in context.

F4 · Frame
A diagnostic panel for IP assignment, device status, switch monitoring, route tracing, and connectivity checks.

F5 · Frame
A searchable log interface designed for filtering, organizing, and exporting clean event trails.
Final product experience
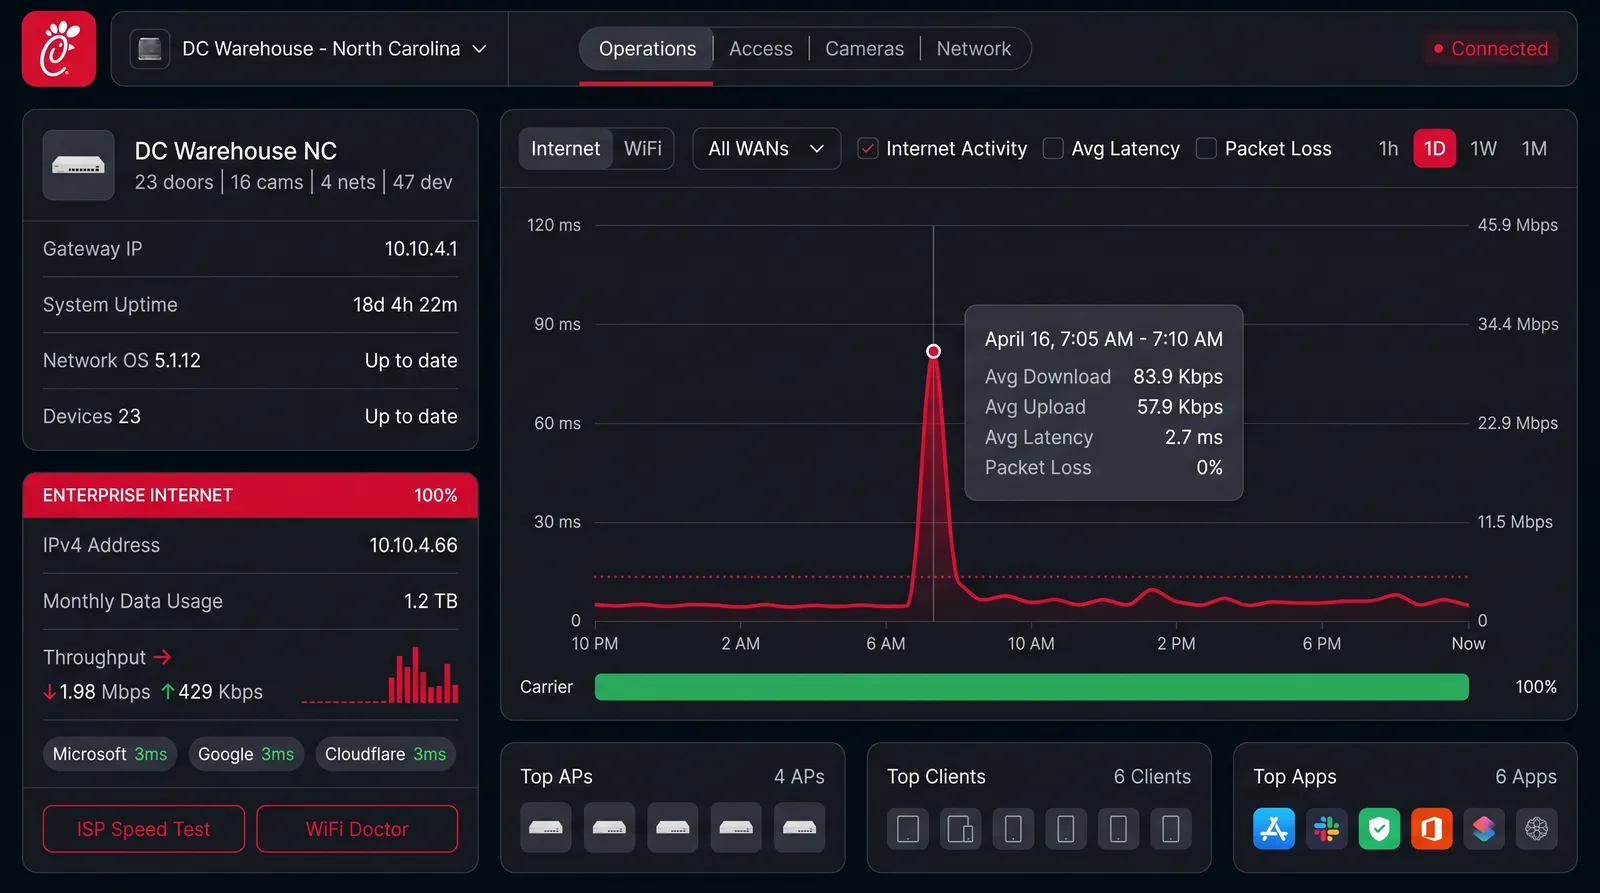
Module surfaces
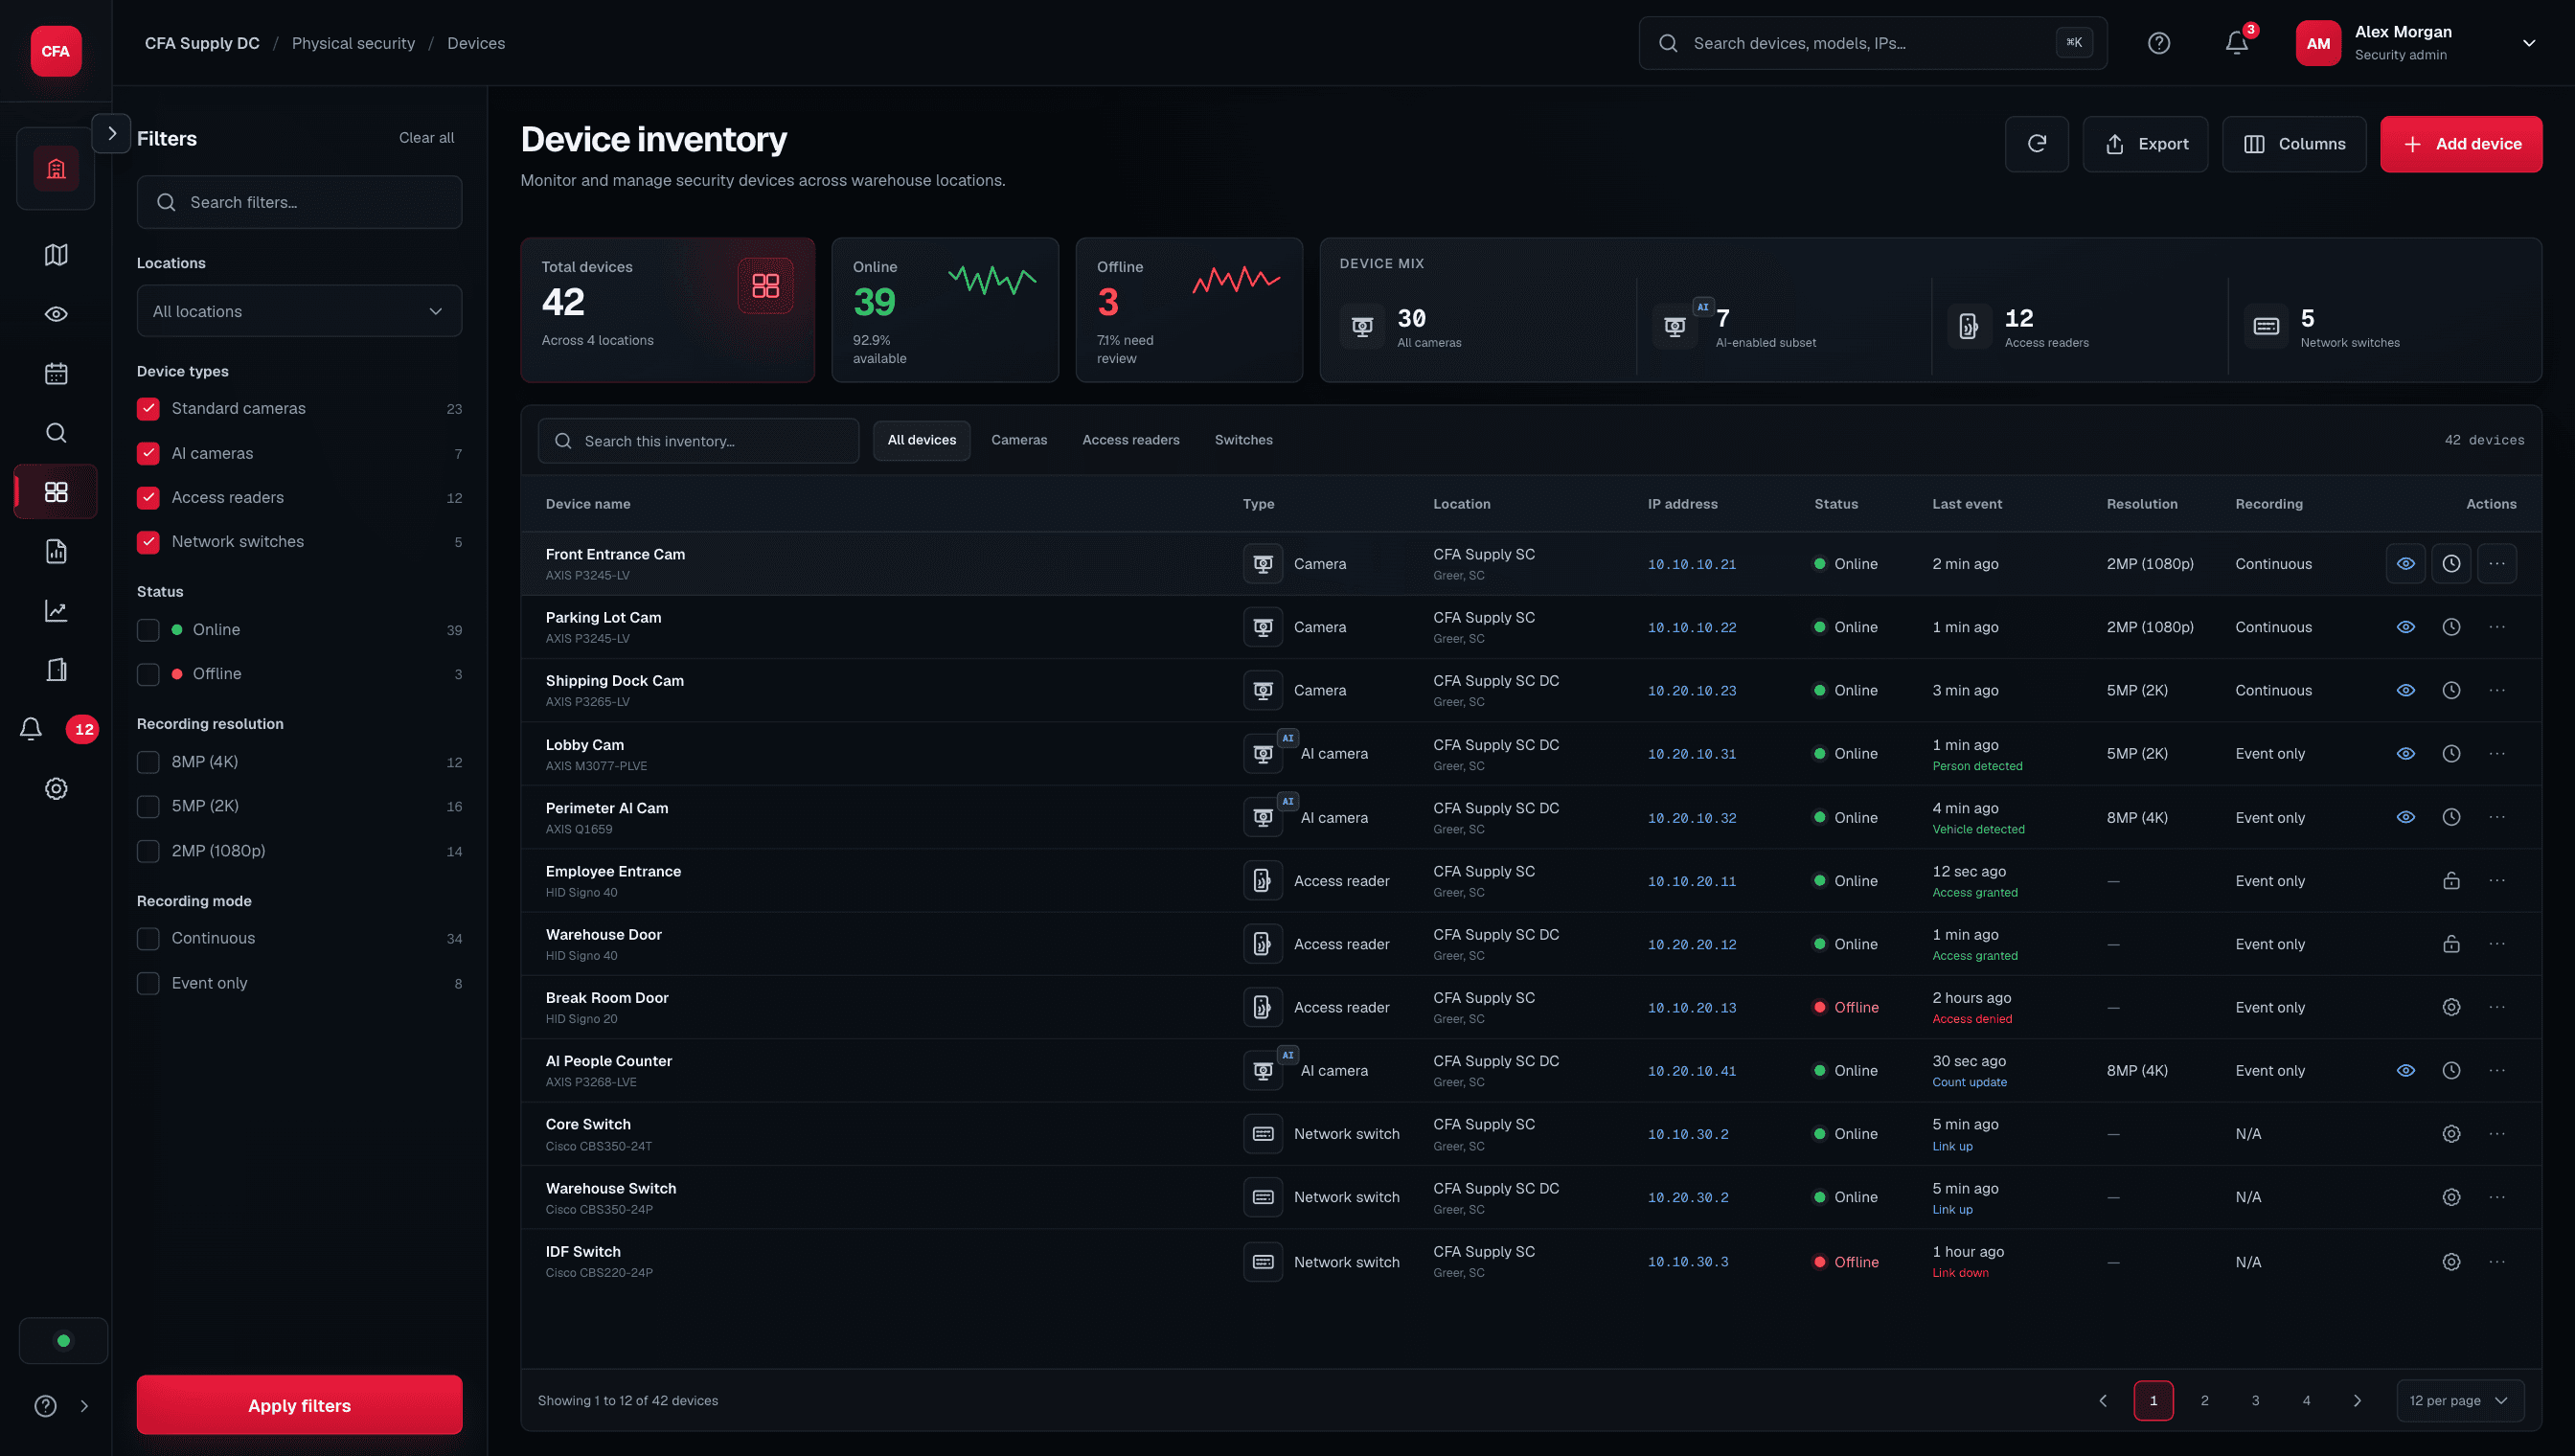
Each surface frames the same idea: a security signal moves from high-level health to investigation to controlled action without losing context.
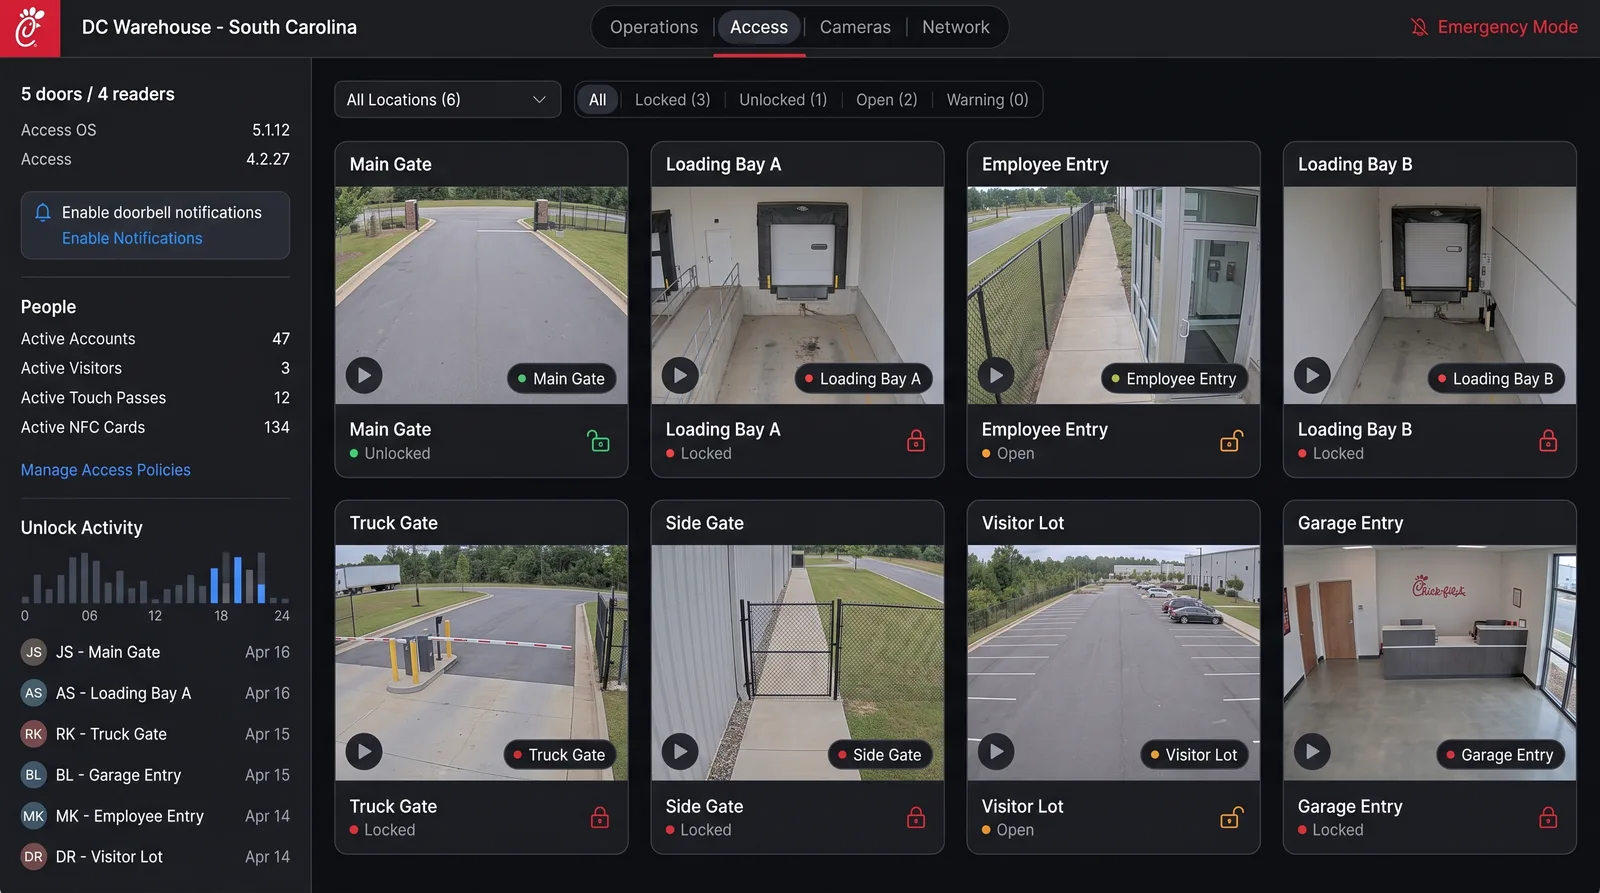
Access Control
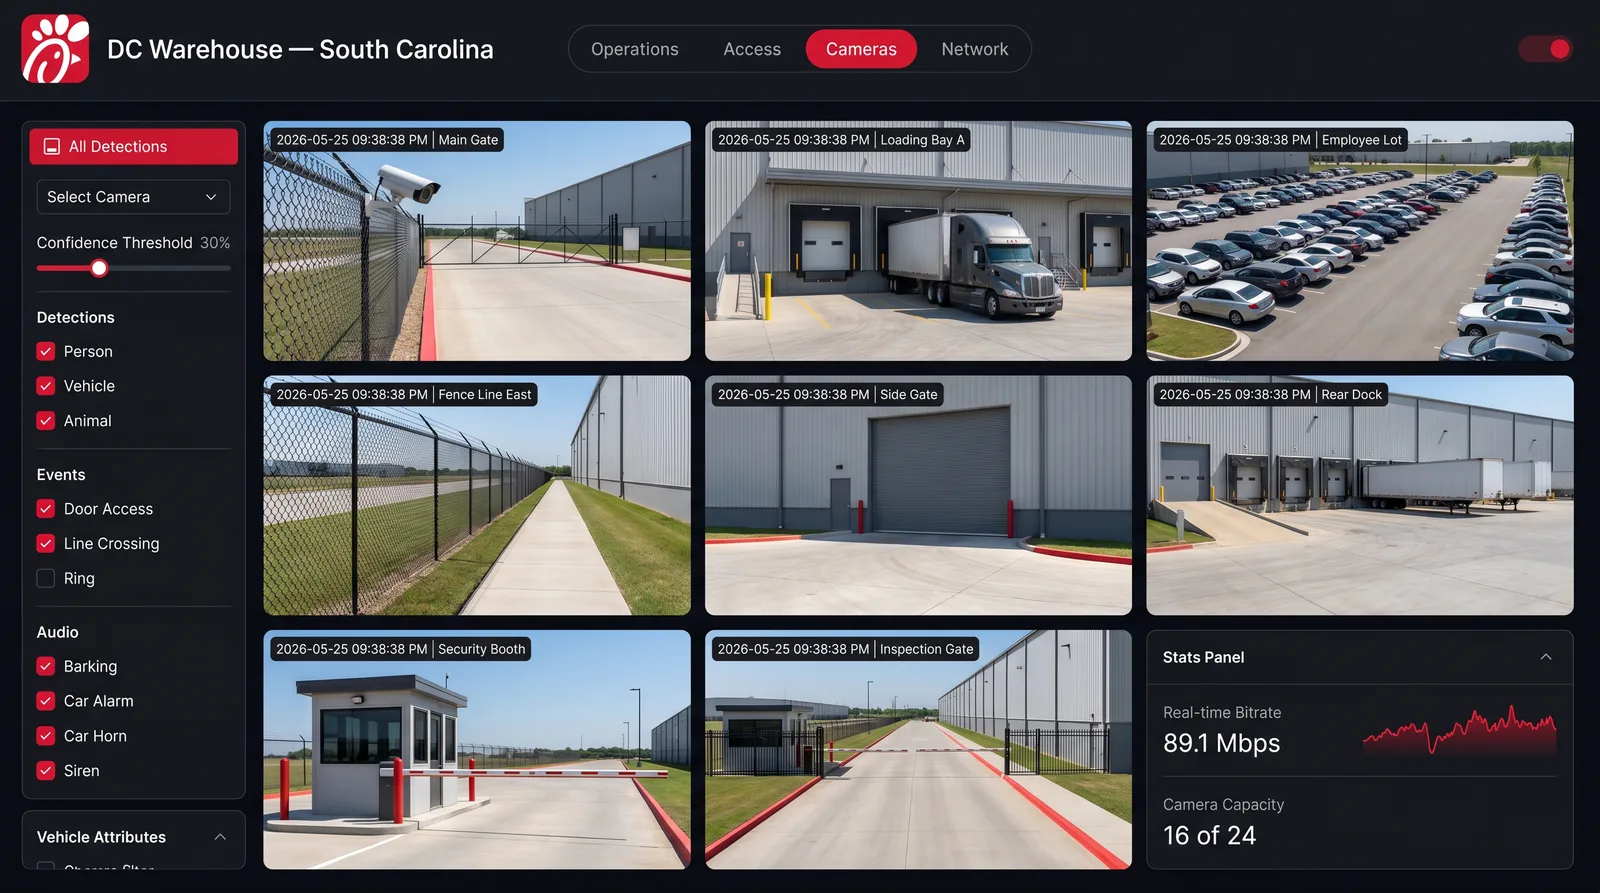
Camera Operations
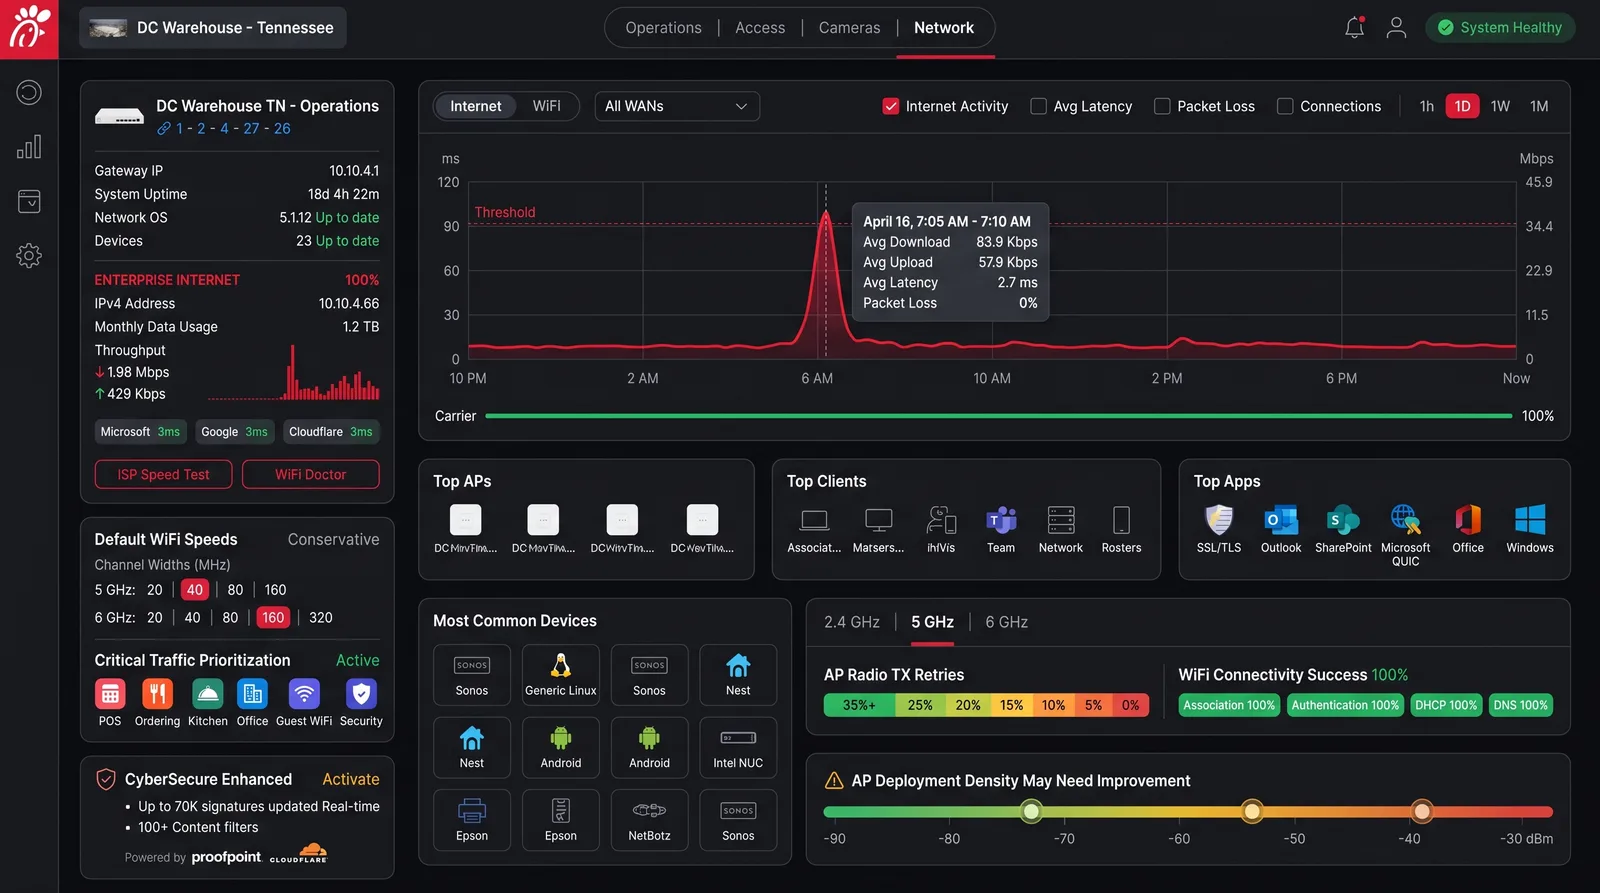
Network & IP Diagnostics
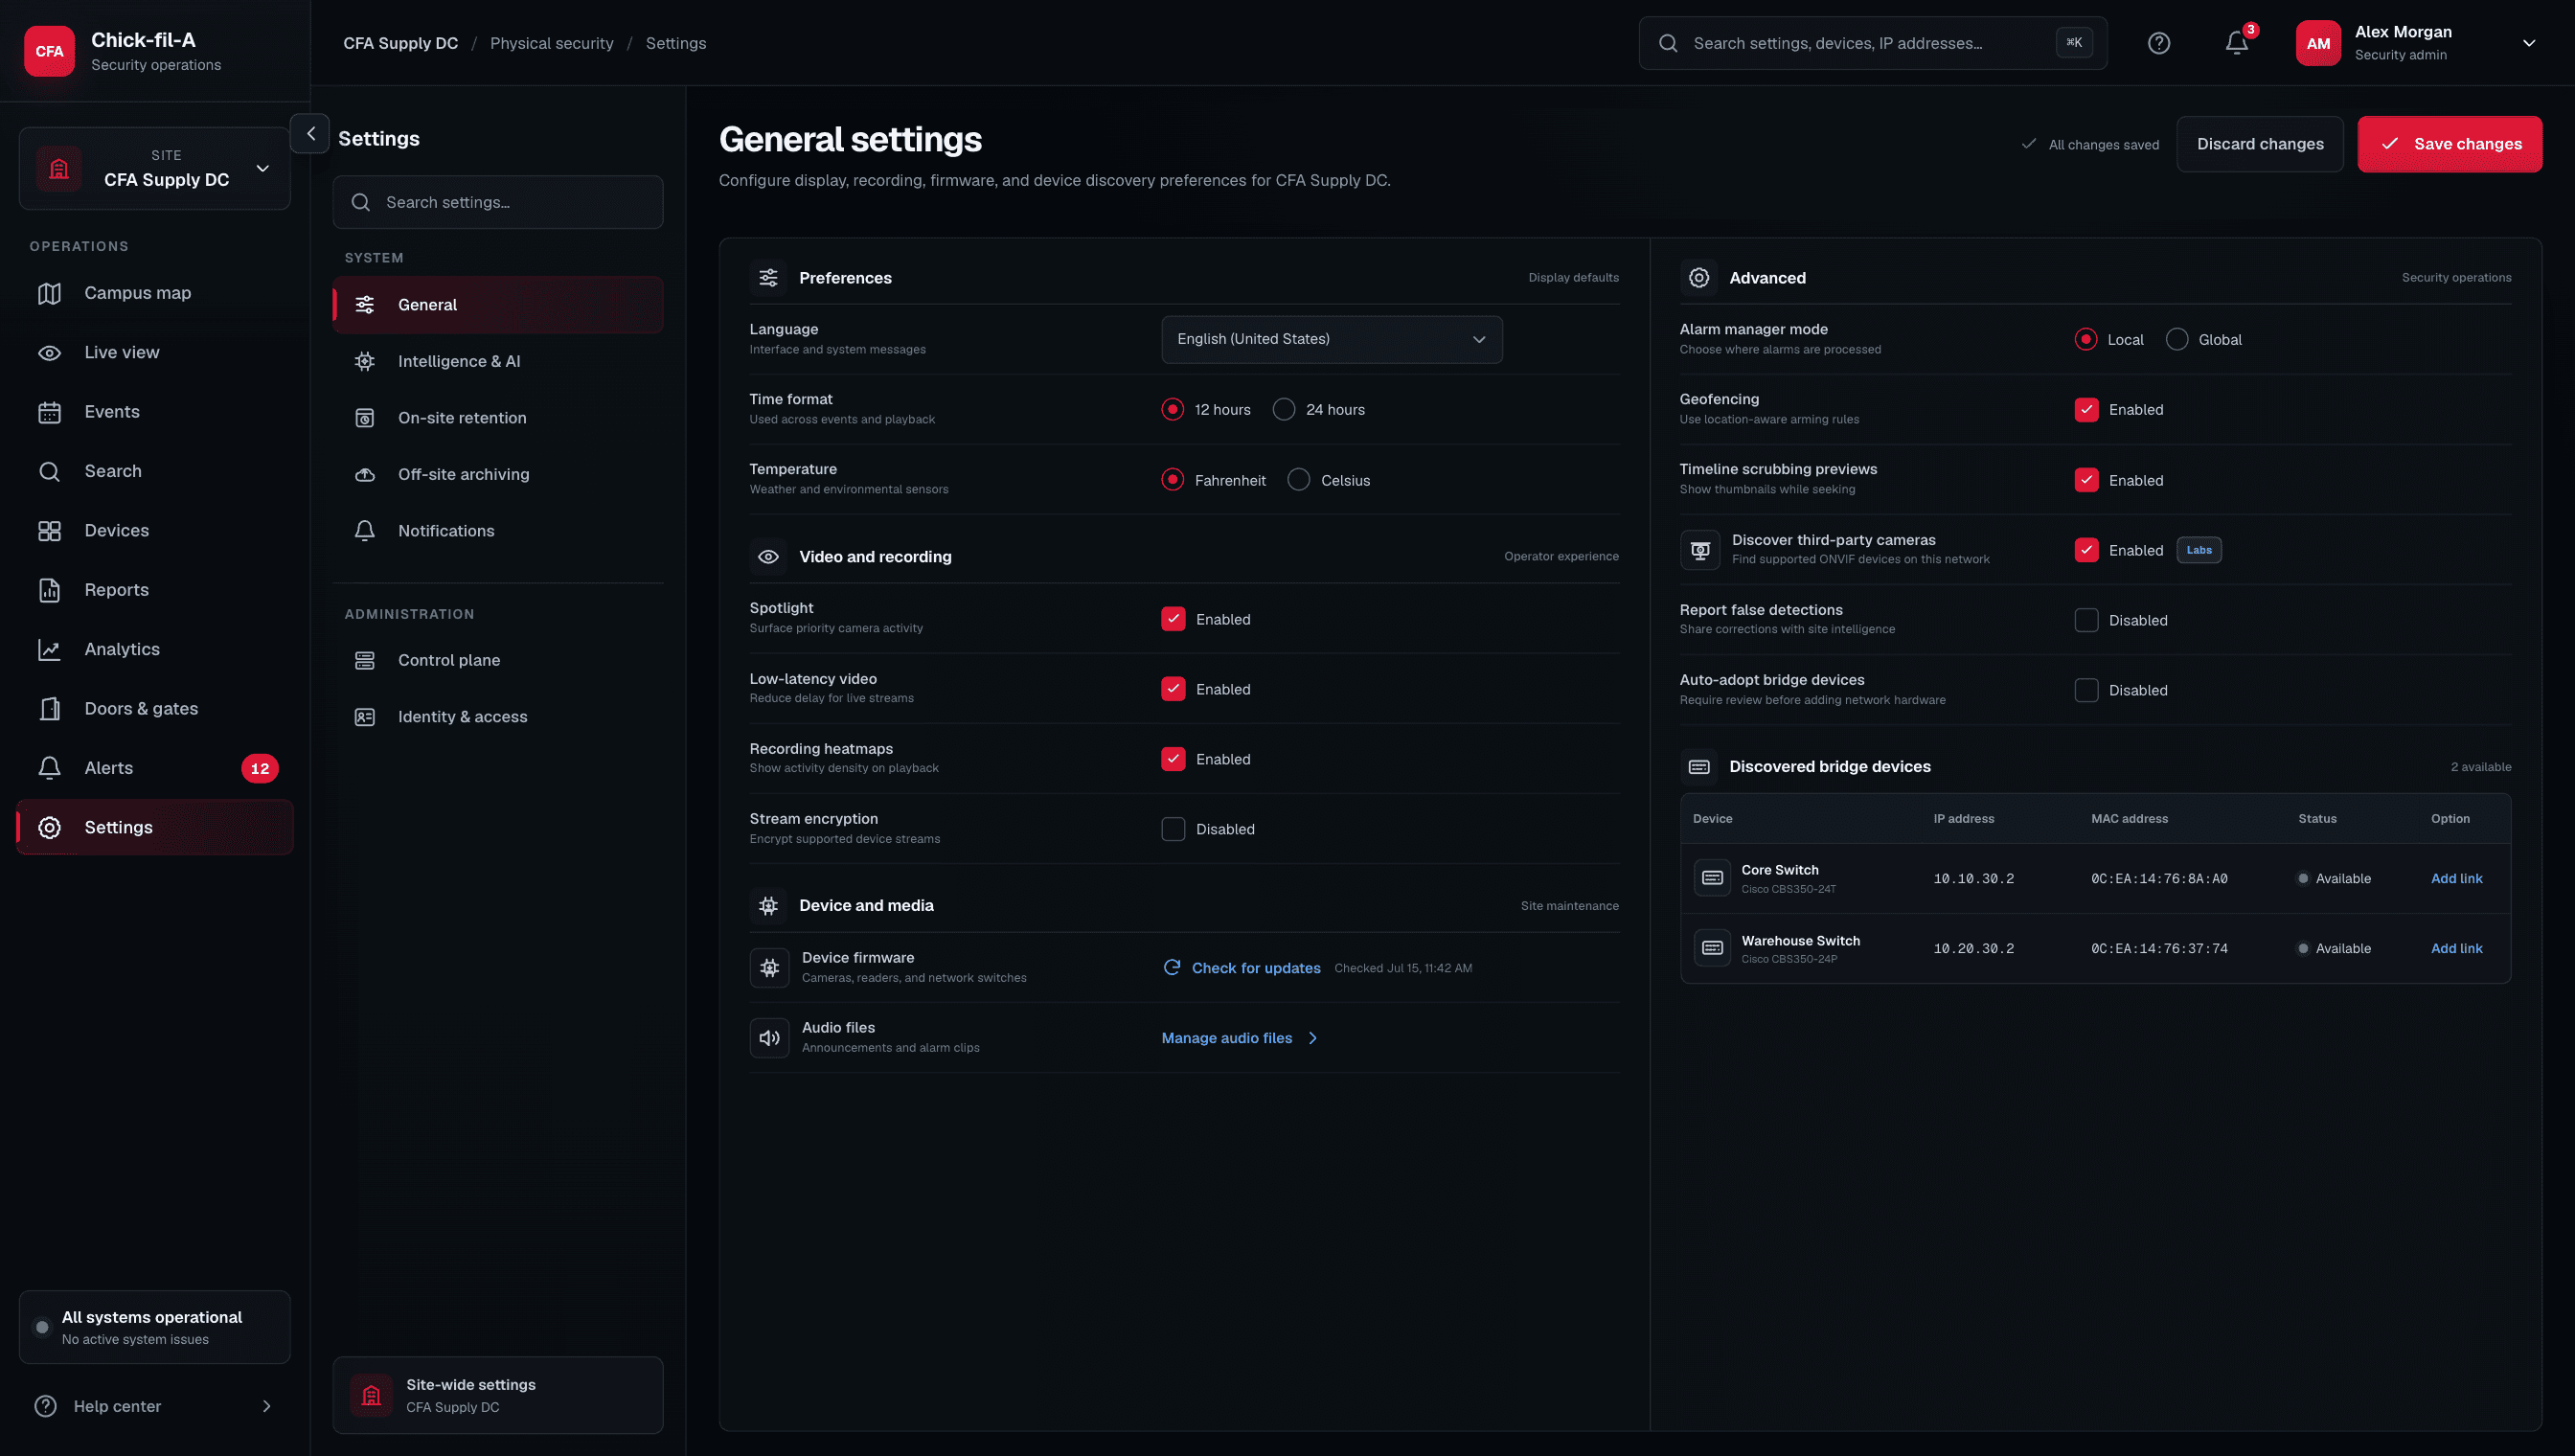
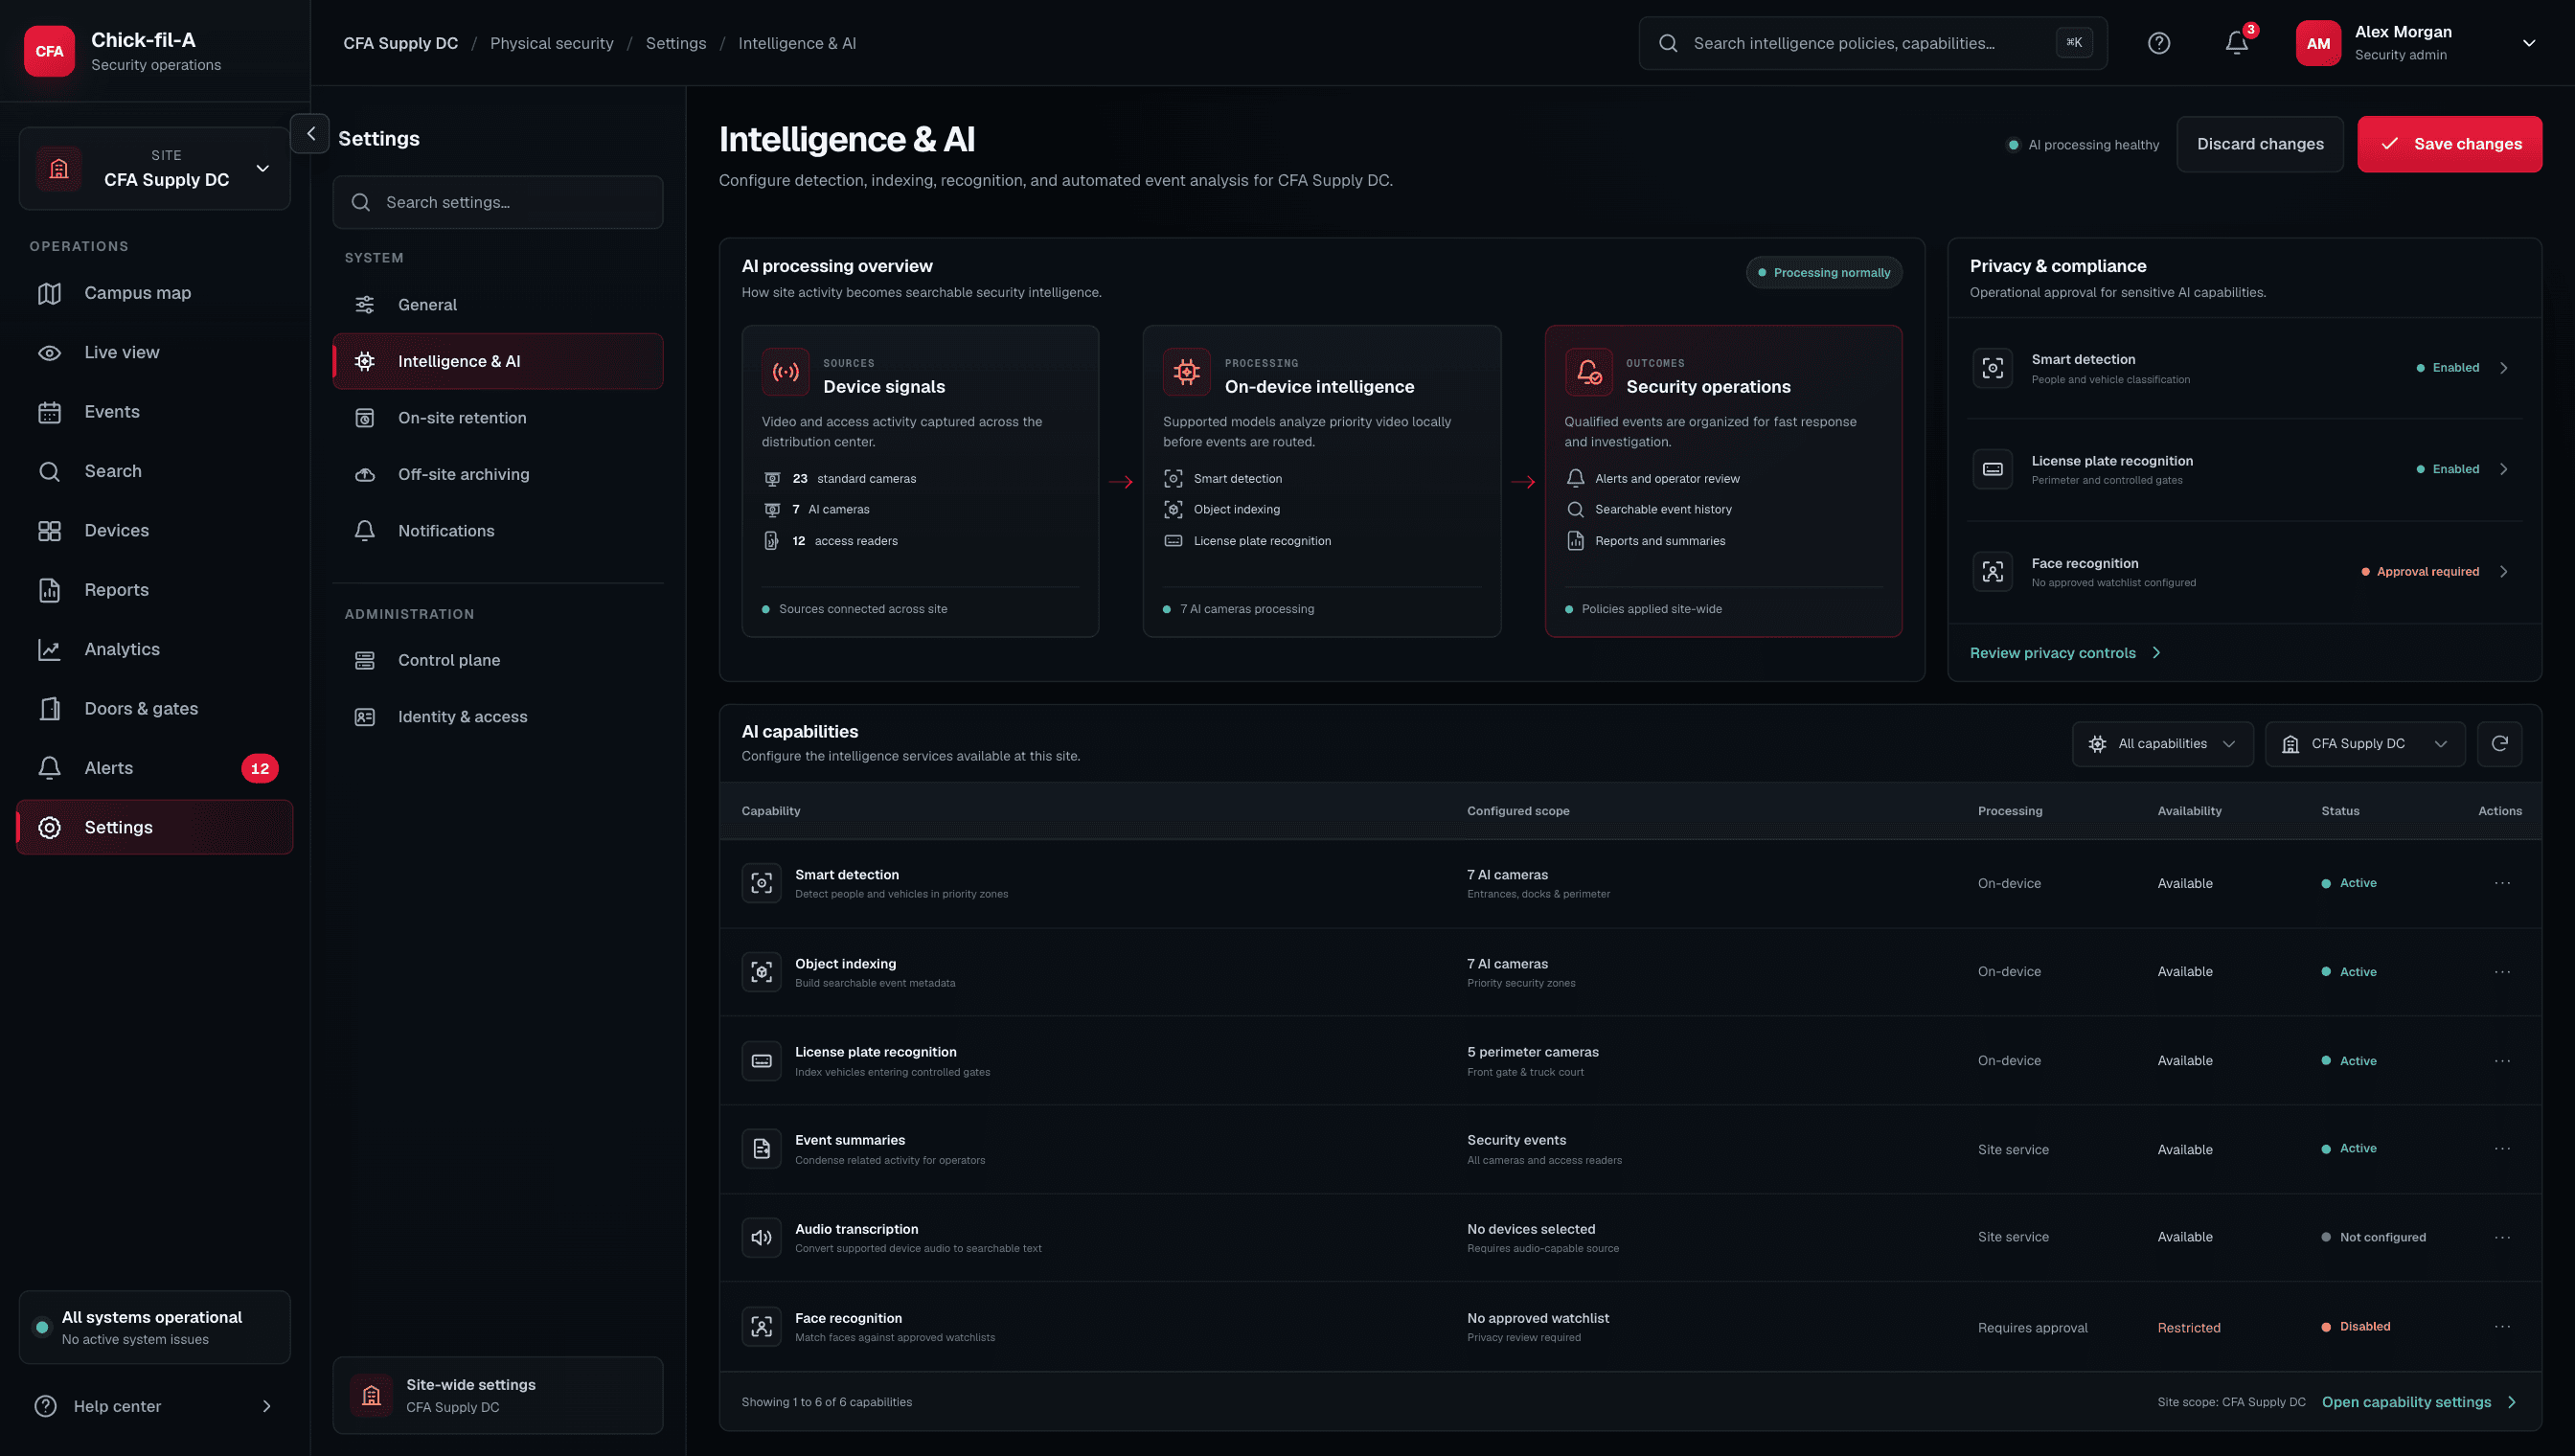
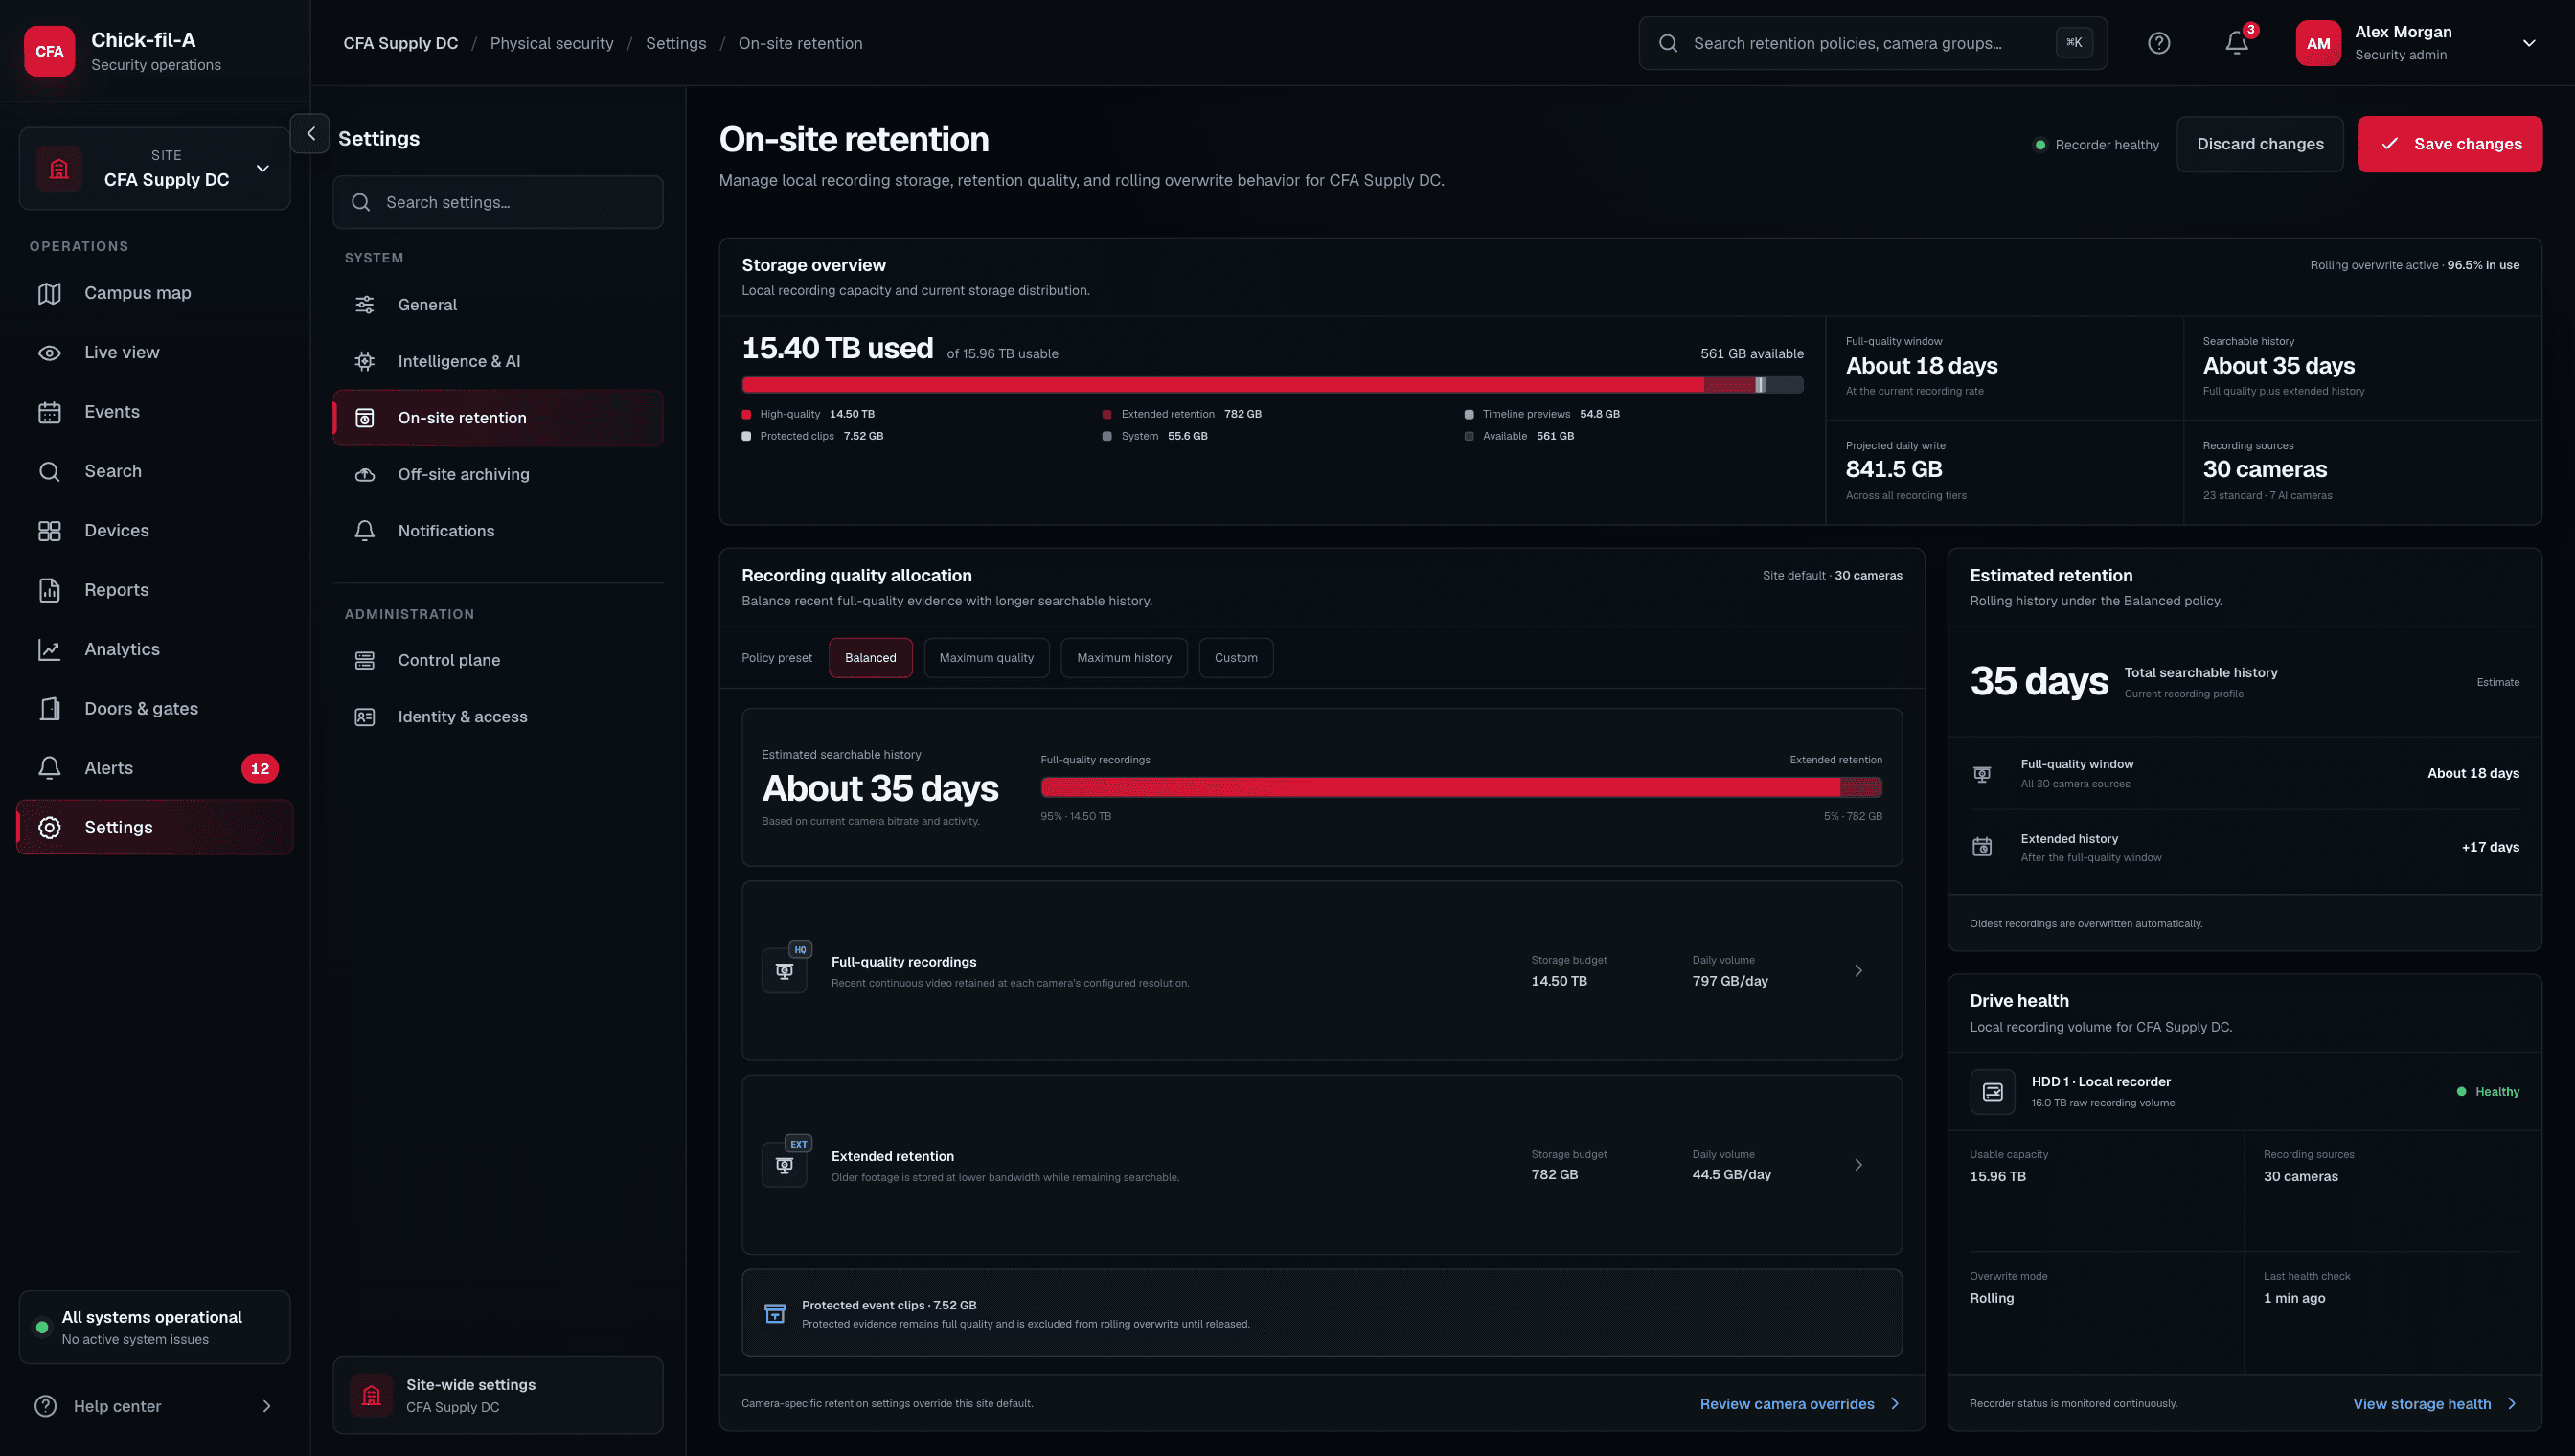
Control & configuration
Device oversight, operating preferences, intelligence controls, and retention policy live in a consistent administrative layer.
04 system views
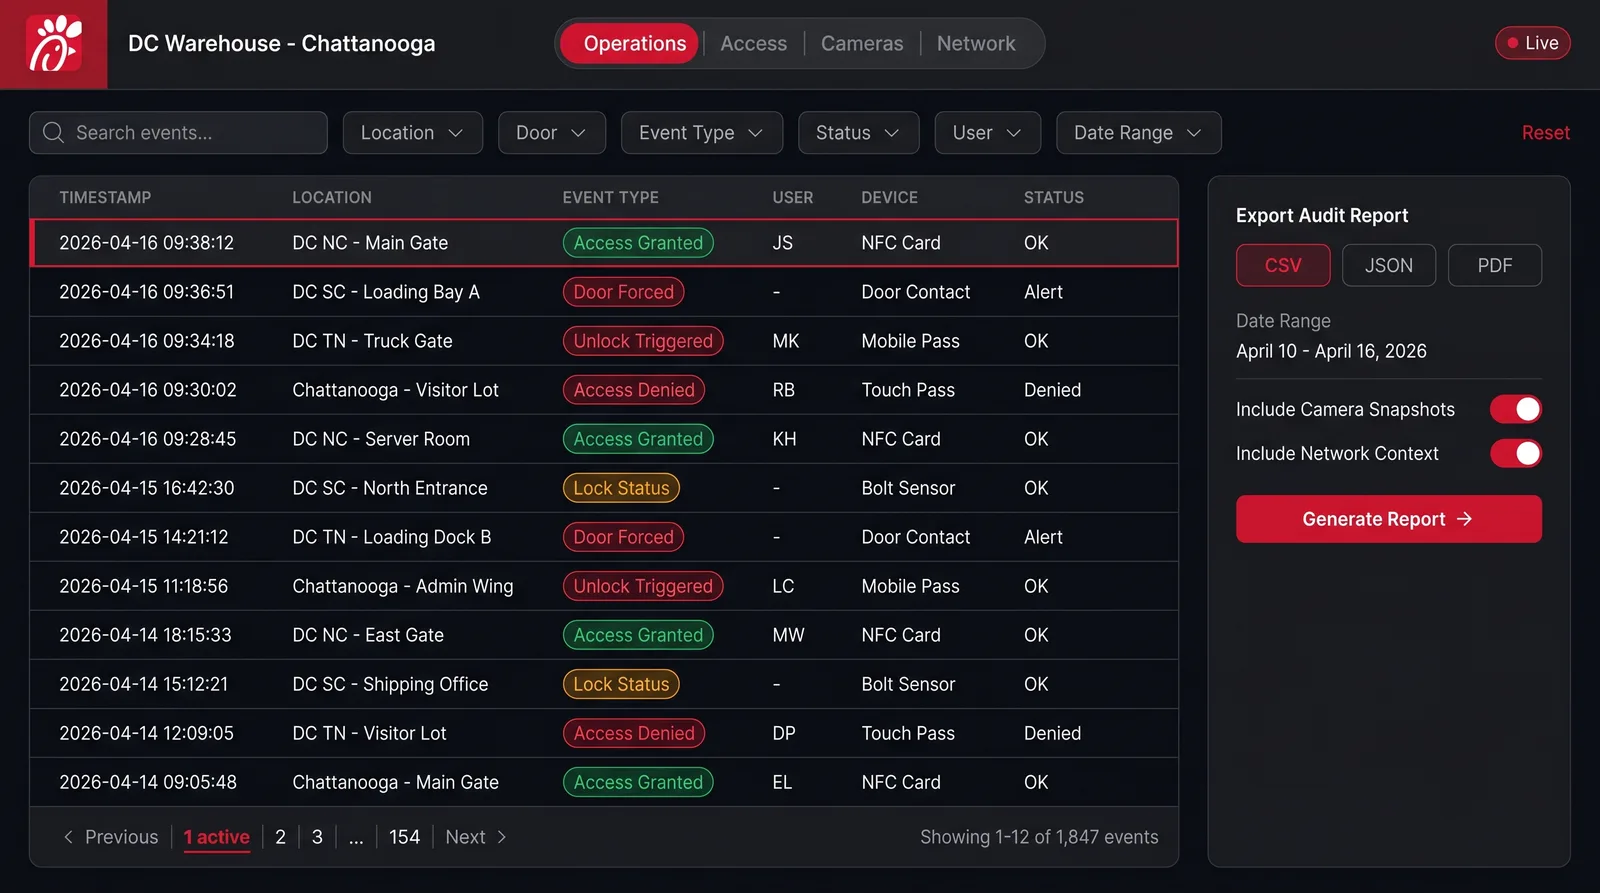
Audit-ready trail
Operational intelligence layer
The dashboard was designed to make operational signals easier to interpret. Instead of forcing users to manually piece together door events, camera status, network checks, and logs, the interface organizes these signals around investigation and action.
Important alerts like forced entry, access denied, offline cameras, and failed connectivity can be surfaced above routine system noise.
Door events, camera status, device records, switch information, and timestamps can be reviewed together to support faster investigation.
Logs and event trails can be organized into cleaner exportable records for review, reporting, and compliance.
Future AI opportunities
These directions are framed as opportunities, not claims. They reflect where AI could strengthen monitoring, investigation, and device health without replacing human judgment.
“The goal is not to automate away human judgment. The goal is to help operators see risk, context, and next steps faster.”
Design decisions
Before and after
Before
After
Relevance to complex enterprise products
This dashboard was more than a monitoring tool. It was a high-trust operational system designed to help teams understand complex infrastructure, verify events, diagnose technical problems, and act with confidence. The same product design principles apply anywhere users need to turn live data, alerts, system states, and logs into clear decisions.
This type of workflow thinking is relevant for products that rely on

Reflection
The biggest lesson from this project is that enterprise dashboards need more than clean visuals. They need clarity, trust, permissions, system state transparency, and auditability. When a dashboard supports security, access control, cameras, and infrastructure, every design decision should help the user understand what is happening, why it matters, and what action is safe to take.
A security operations dashboard has to make users confident in what they are seeing before they act.
Connecting doors, cameras, devices, network state, and logs helps operators investigate faster.
Every meaningful event and action should be searchable, reviewable, and exportable.
Designed for operational confidence
This case study represents the type of product work I enjoy most: complex systems, live operational data, high-trust workflows, technical diagnostics, and interfaces that help teams make better decisions faster.