F1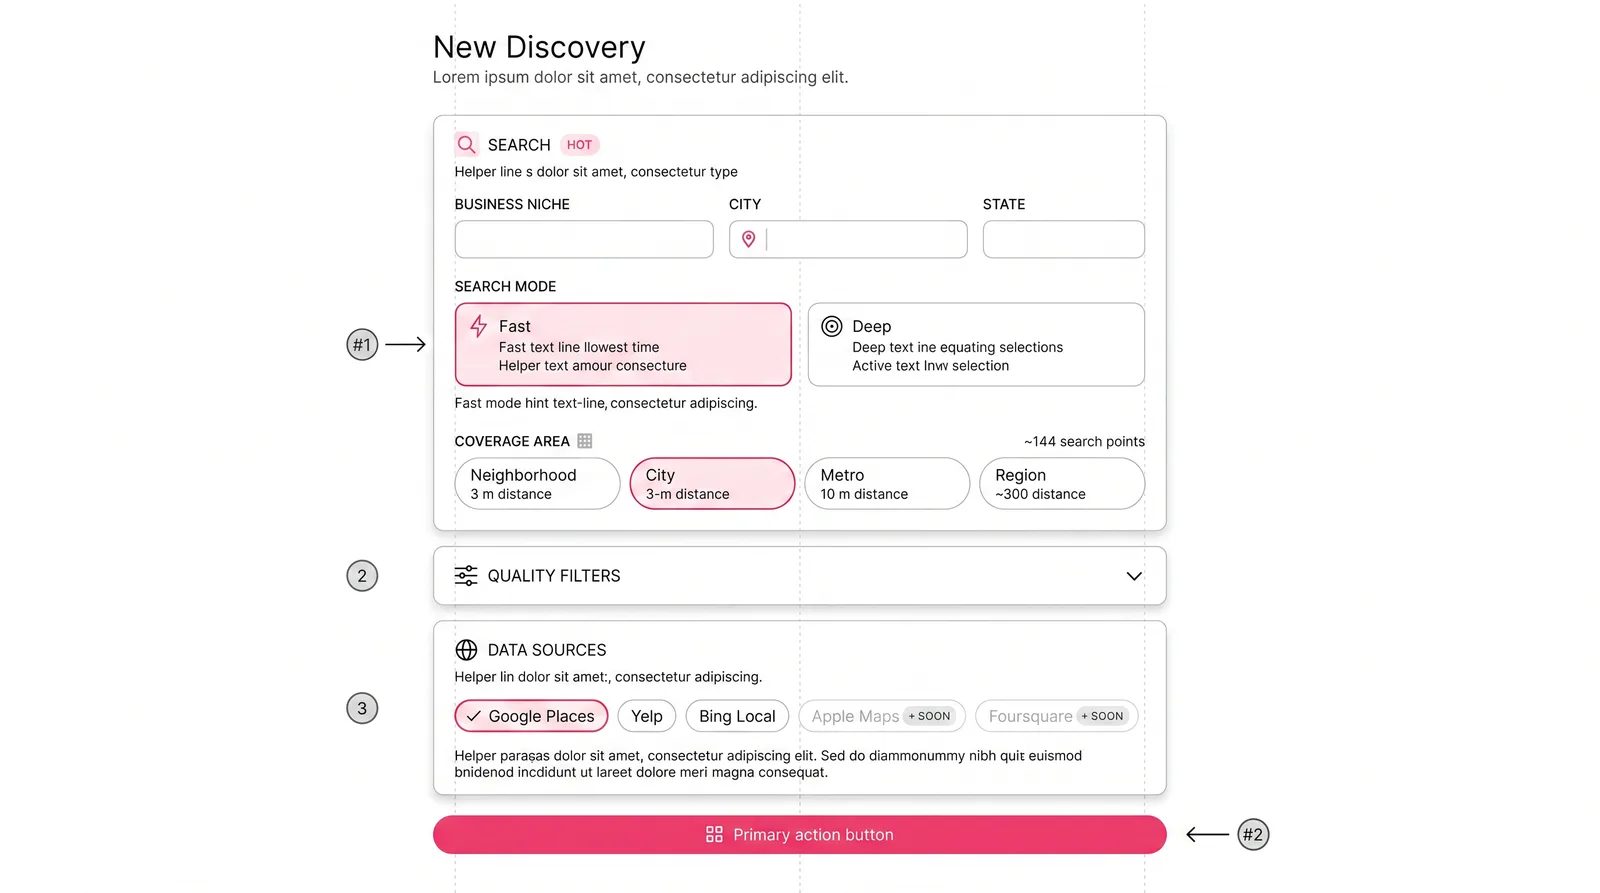
F1 · Frame
Discovery Configuration
Niche, location, fast vs. deep search mode, coverage radius, and which data sources are searched in parallel.
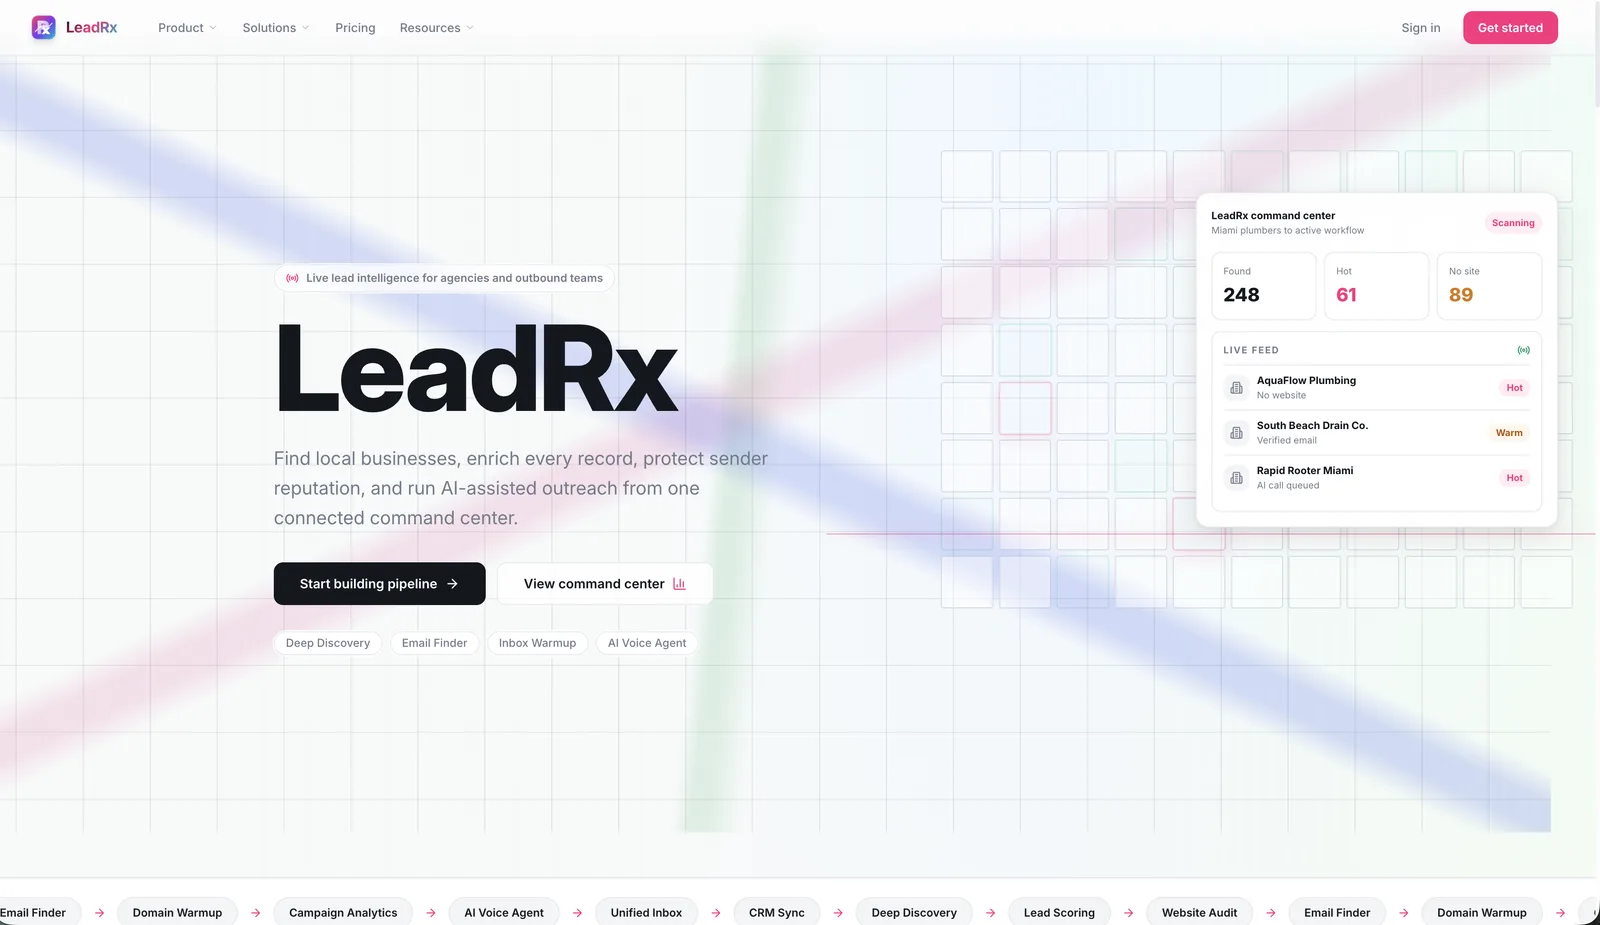
Introducing Orbyte, a full platform built to help businesses scale and launch custom AI automations.
Product Design Case Study
Turning fragmented business data into an AI-assisted lead intelligence workflow.
LeadRx Insights was designed to help users search territories, discover local businesses, evaluate digital presence, identify opportunity signals, and prioritize outreach with AI-assisted scoring.
Role
Product Designer / Founder
Focus
AI-assisted UX, dashboards, lead scoring, workflow design
Platform
Web app / SaaS dashboard
Status
Product concept and active build
Why this project matters
Most lead discovery workflows are messy. Users jump between Google, directories, review sites, spreadsheets, CRMs, and manual notes just to understand whether a business is worth contacting. LeadRx was designed around a simpler question: how can we turn scattered business signals into a clear, prioritized workflow?
Businesses can have incomplete, duplicated, outdated, or inconsistent information across sources.
Users do not only need more leads. They need to know which leads are worth pursuing.
Discovery, qualification, scoring, and outreach are usually disconnected.
User and use case
Primary Users
User goal
Find businesses in a target area that show signs of opportunity, then prioritize outreach based on quality, urgency, and fit.
Pain Points
Design principle
The interface should not make the user inspect every detail manually. It should surface the most important signals first, then let the user go deeper when needed.
The core workflow
The workflow was designed to move users from search to decision without forcing them to interpret raw data manually.
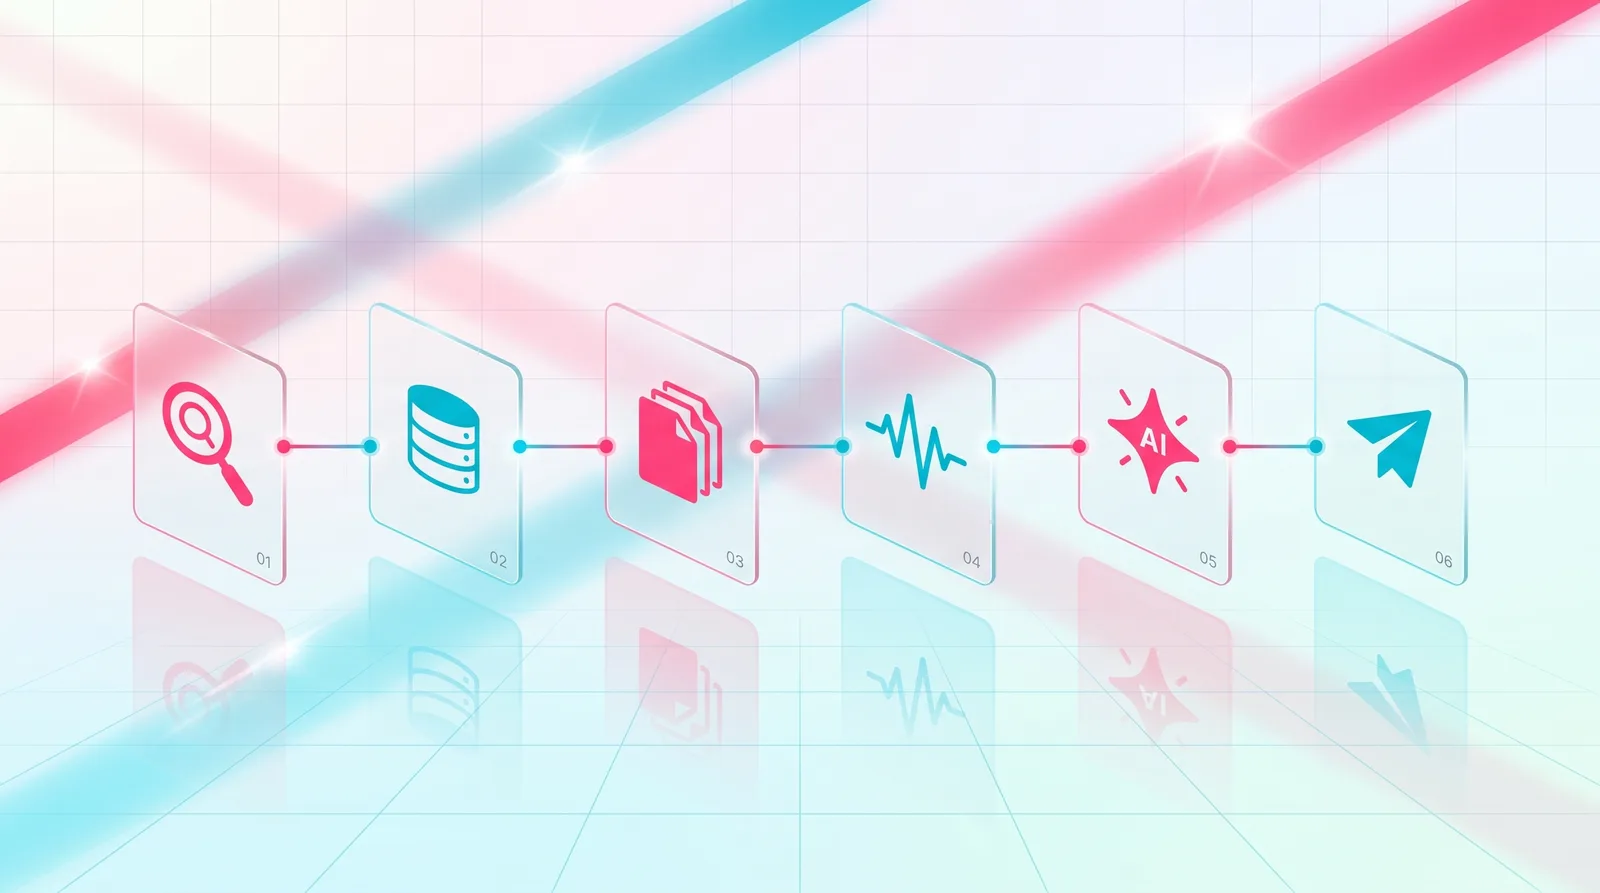
Workflow Diagram
End-to-end map: search → signals → cleanup → evaluation → AI scoring → review.
UX challenge
Problem statement
Lead discovery tools often overwhelm users with tables, filters, and raw records. That creates a false sense of productivity while still leaving the user unsure which business to contact first.
Design goal
Create an experience where every lead has context:
“Good AI UX should not only provide an answer. It should explain why the answer is useful.”
Wireframe story
Drag through the four wireframes that defined the workflow: configuration → live results → enrichment → action.
F1 · Frame
Niche, location, fast vs. deep search mode, coverage radius, and which data sources are searched in parallel.

F2 · Frame
Split map and live feed view. Hot leads surface on the map and rise to the top of the list as scanning runs.

F3 · Frame
Pipeline of website checks, social signals, duplicate detection, and AI scoring with HOT/WARM badges per lead.

F4 · Frame
Toolbar that turns a qualified set into outreach: generate copy for hot leads, view, enrich, or find emails.
Final product experience
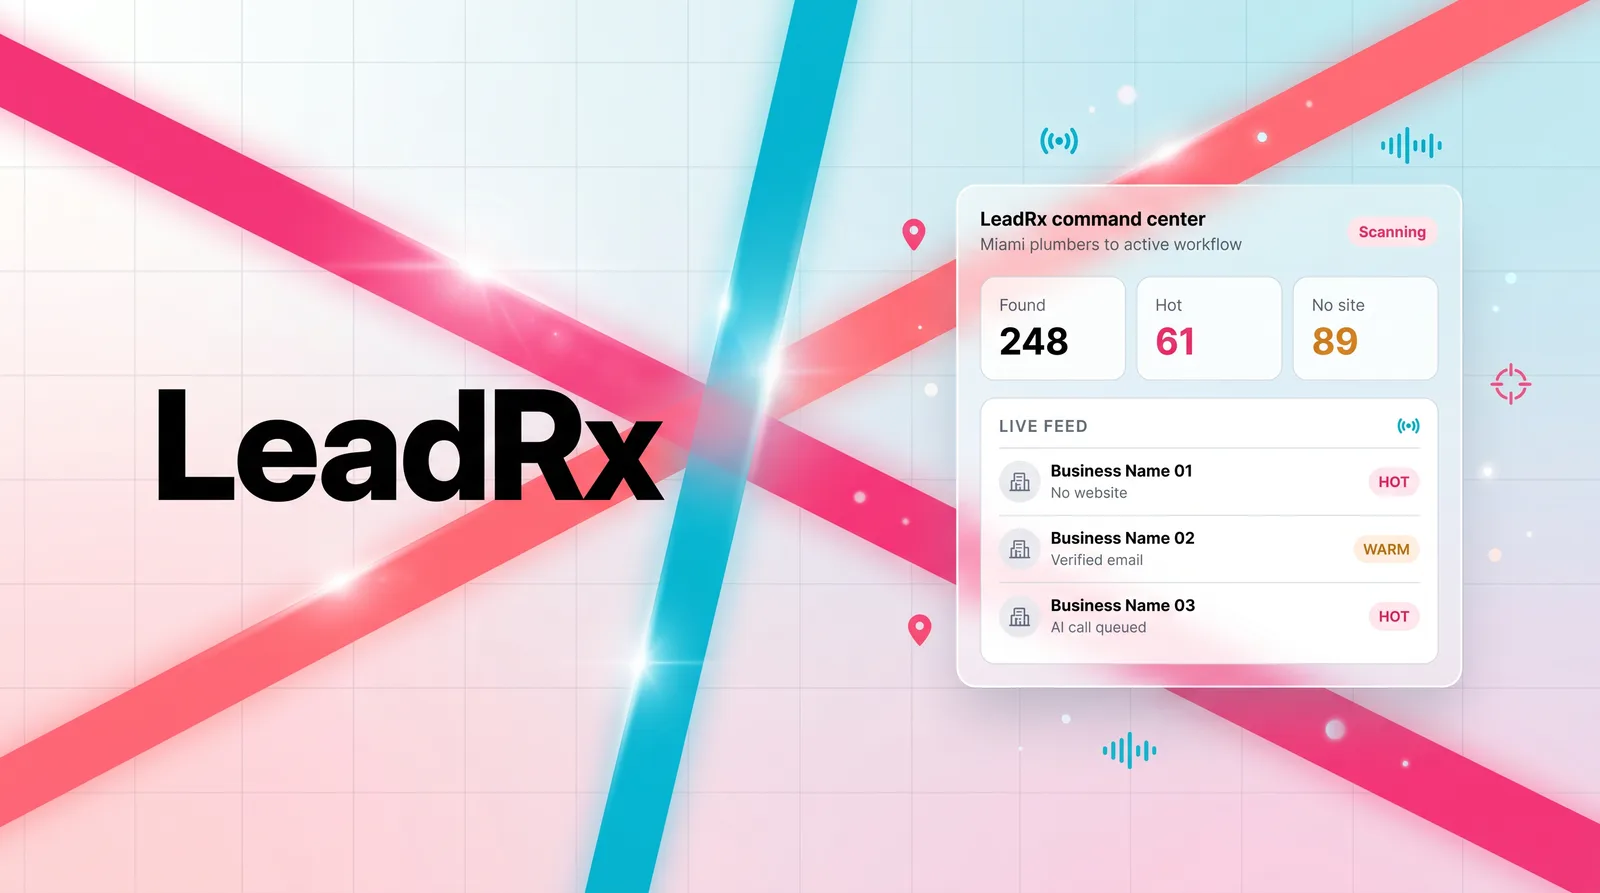
Product surfaces · live captures
Each surface frames the same idea: a lead moves through research, scoring, and outreach in one continuous loop. The platform view shows the live automation; the agencies view shows the same loop scoped to a multi-client workflow; the sales-team view focuses on territory coverage and ready-to-work hot leads.
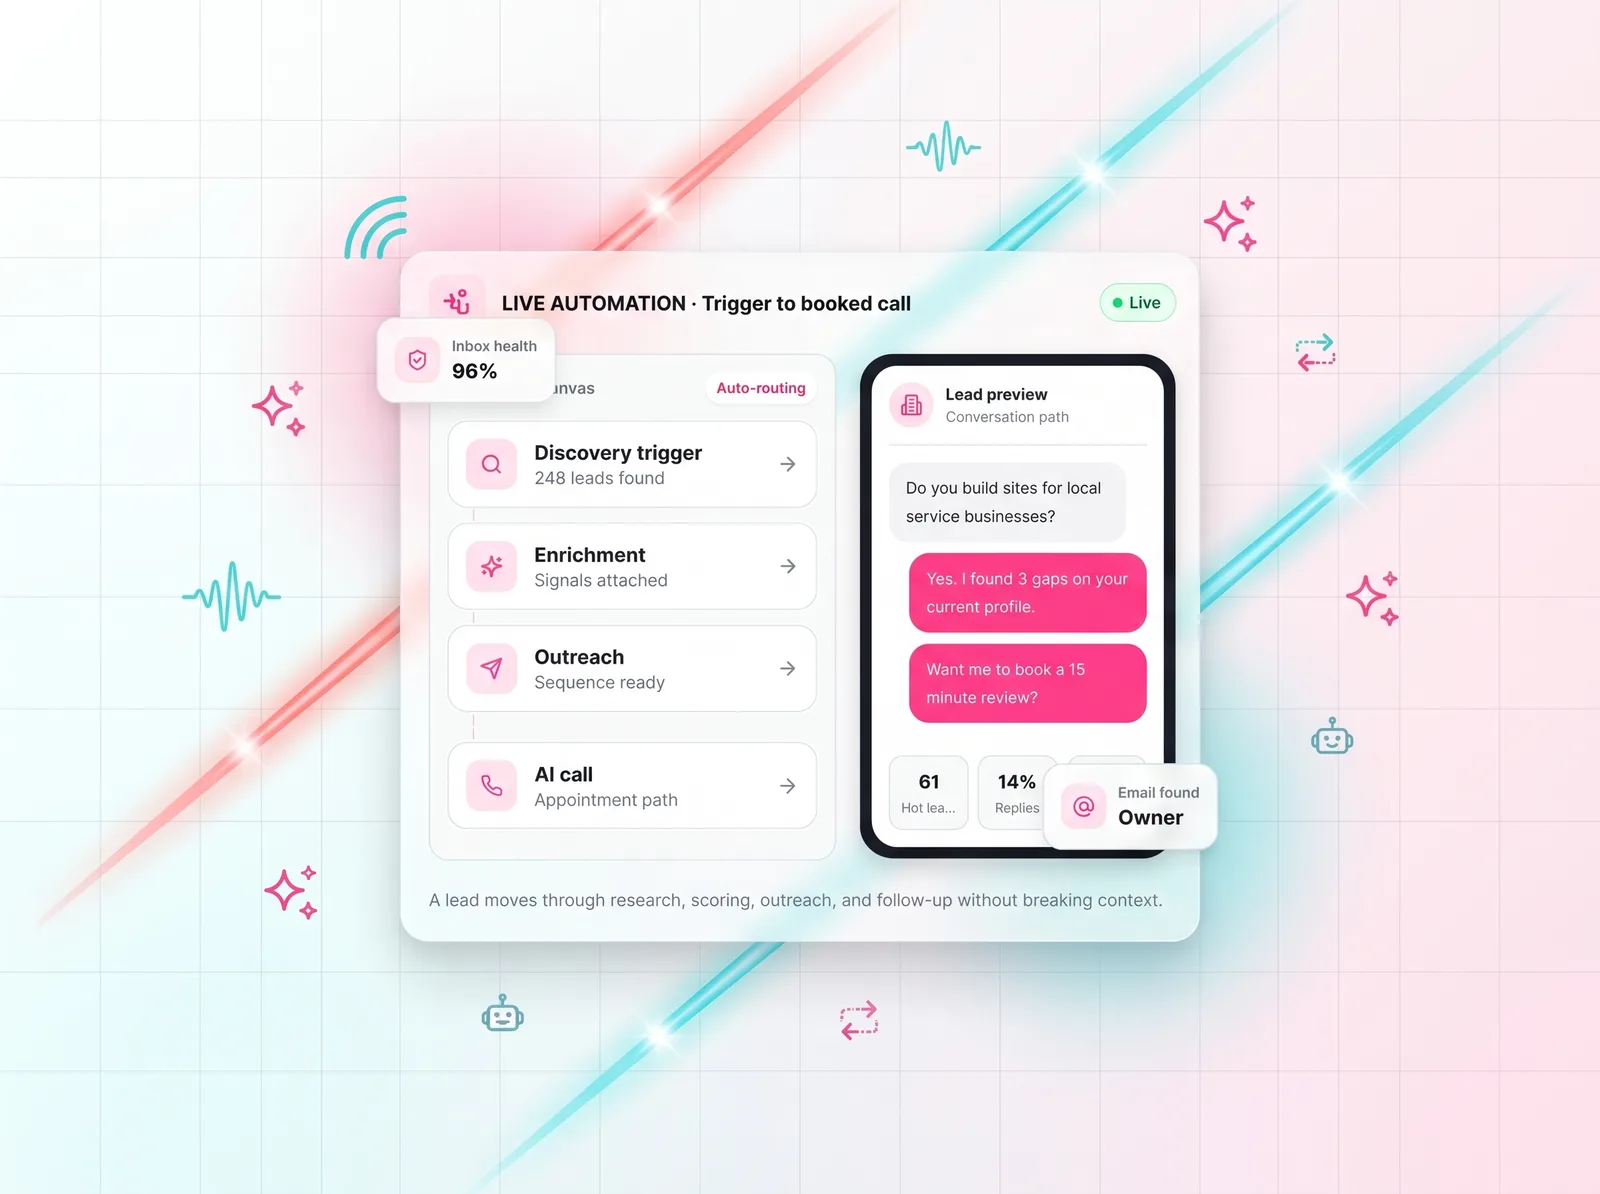
Platform · live automation
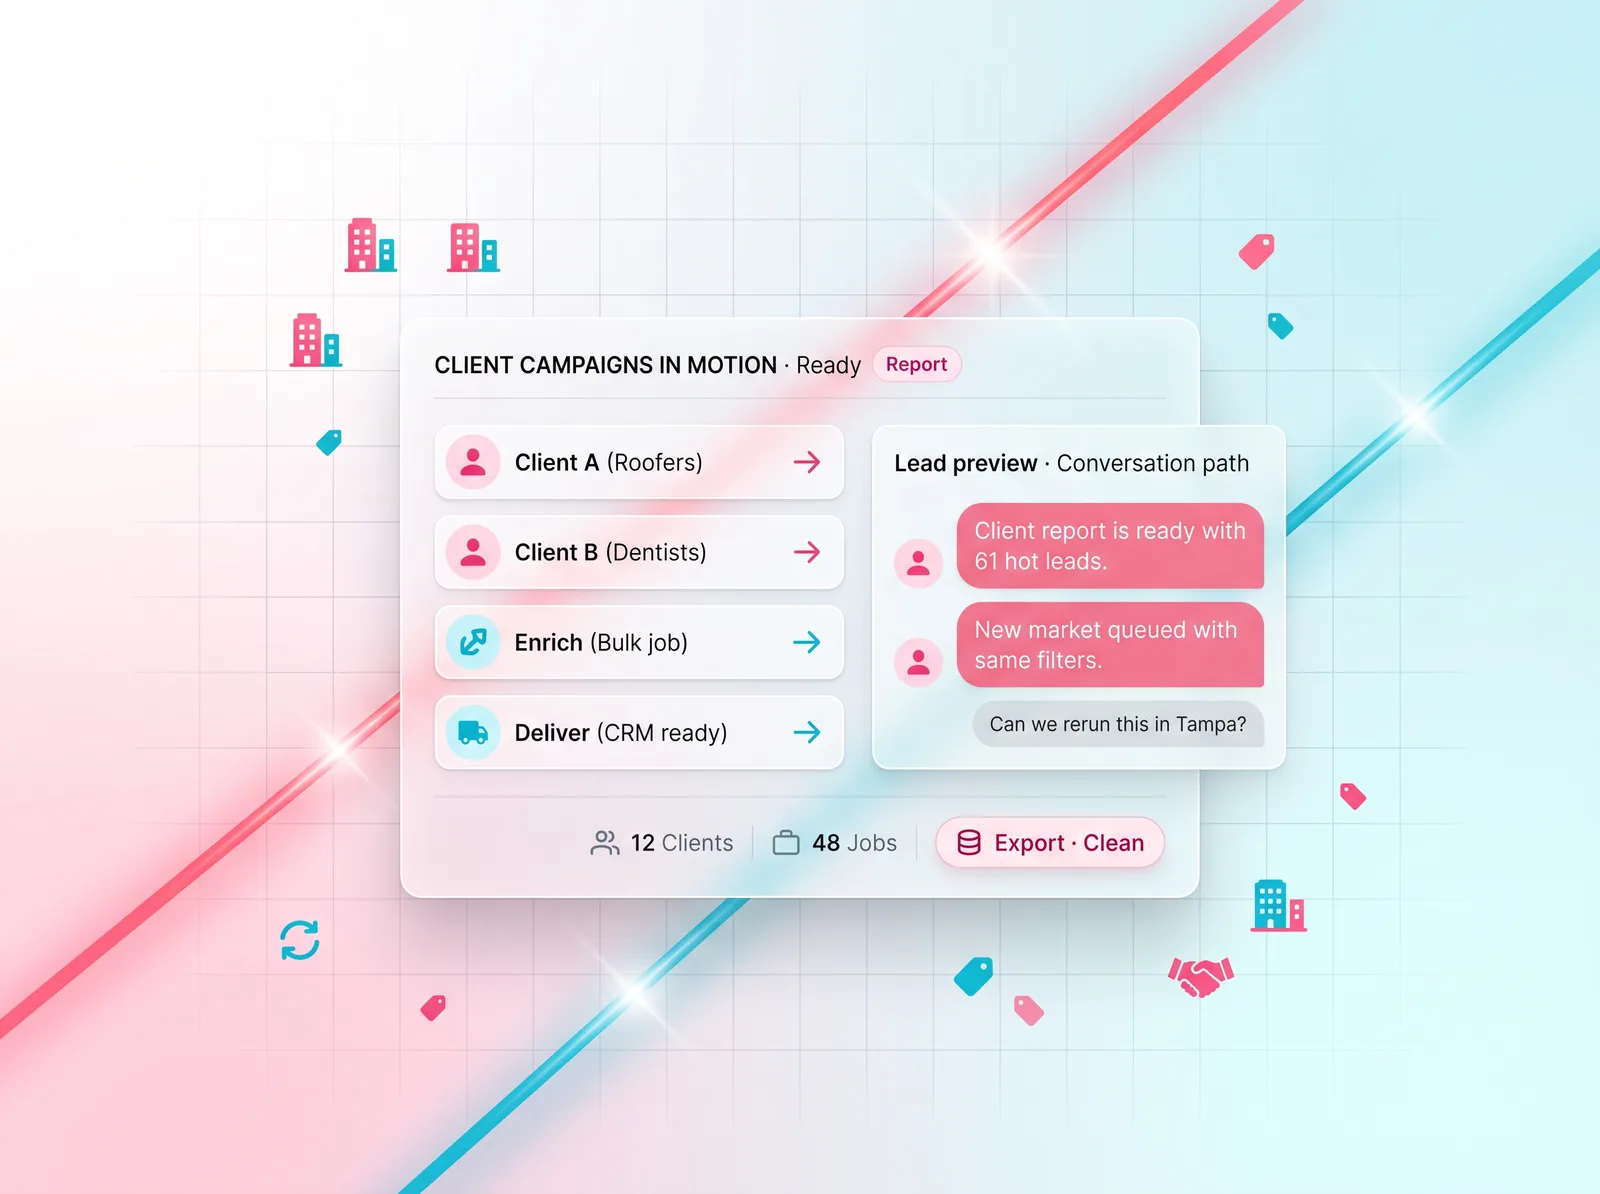
Agencies · client campaigns
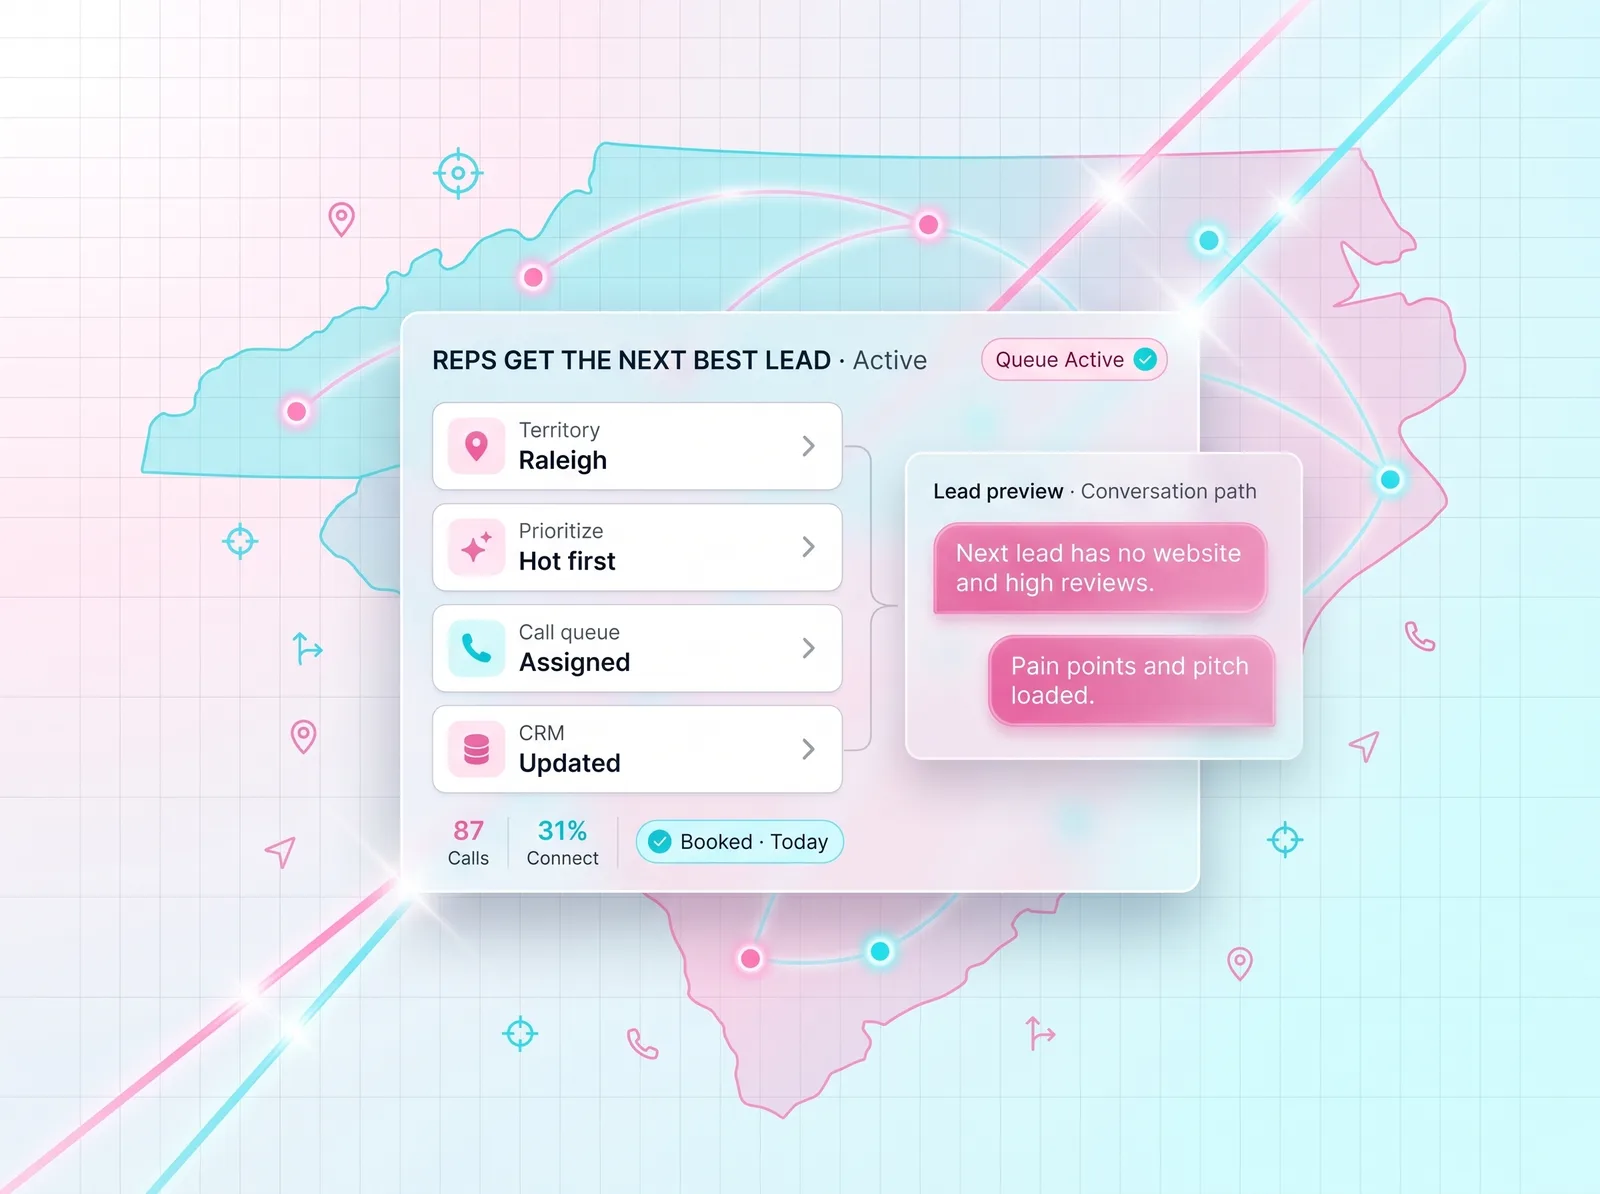
Sales · territory coverage
Each lead can be scored and explained so the user understands why it matters.
Users can filter by website status, reviews, location, category, digital presence, and quality flags.
A detail-first pattern keeps users in context without forcing page reloads or workflow breaks.
Important issues like missing websites, weak digital presence, duplicate data, or low confidence can be surfaced clearly.
The design accounts for loading, empty results, failed API cells, warnings, and rate-limit style issues.
The interface is designed to eventually support export, assignment, outreach, and CRM sync.
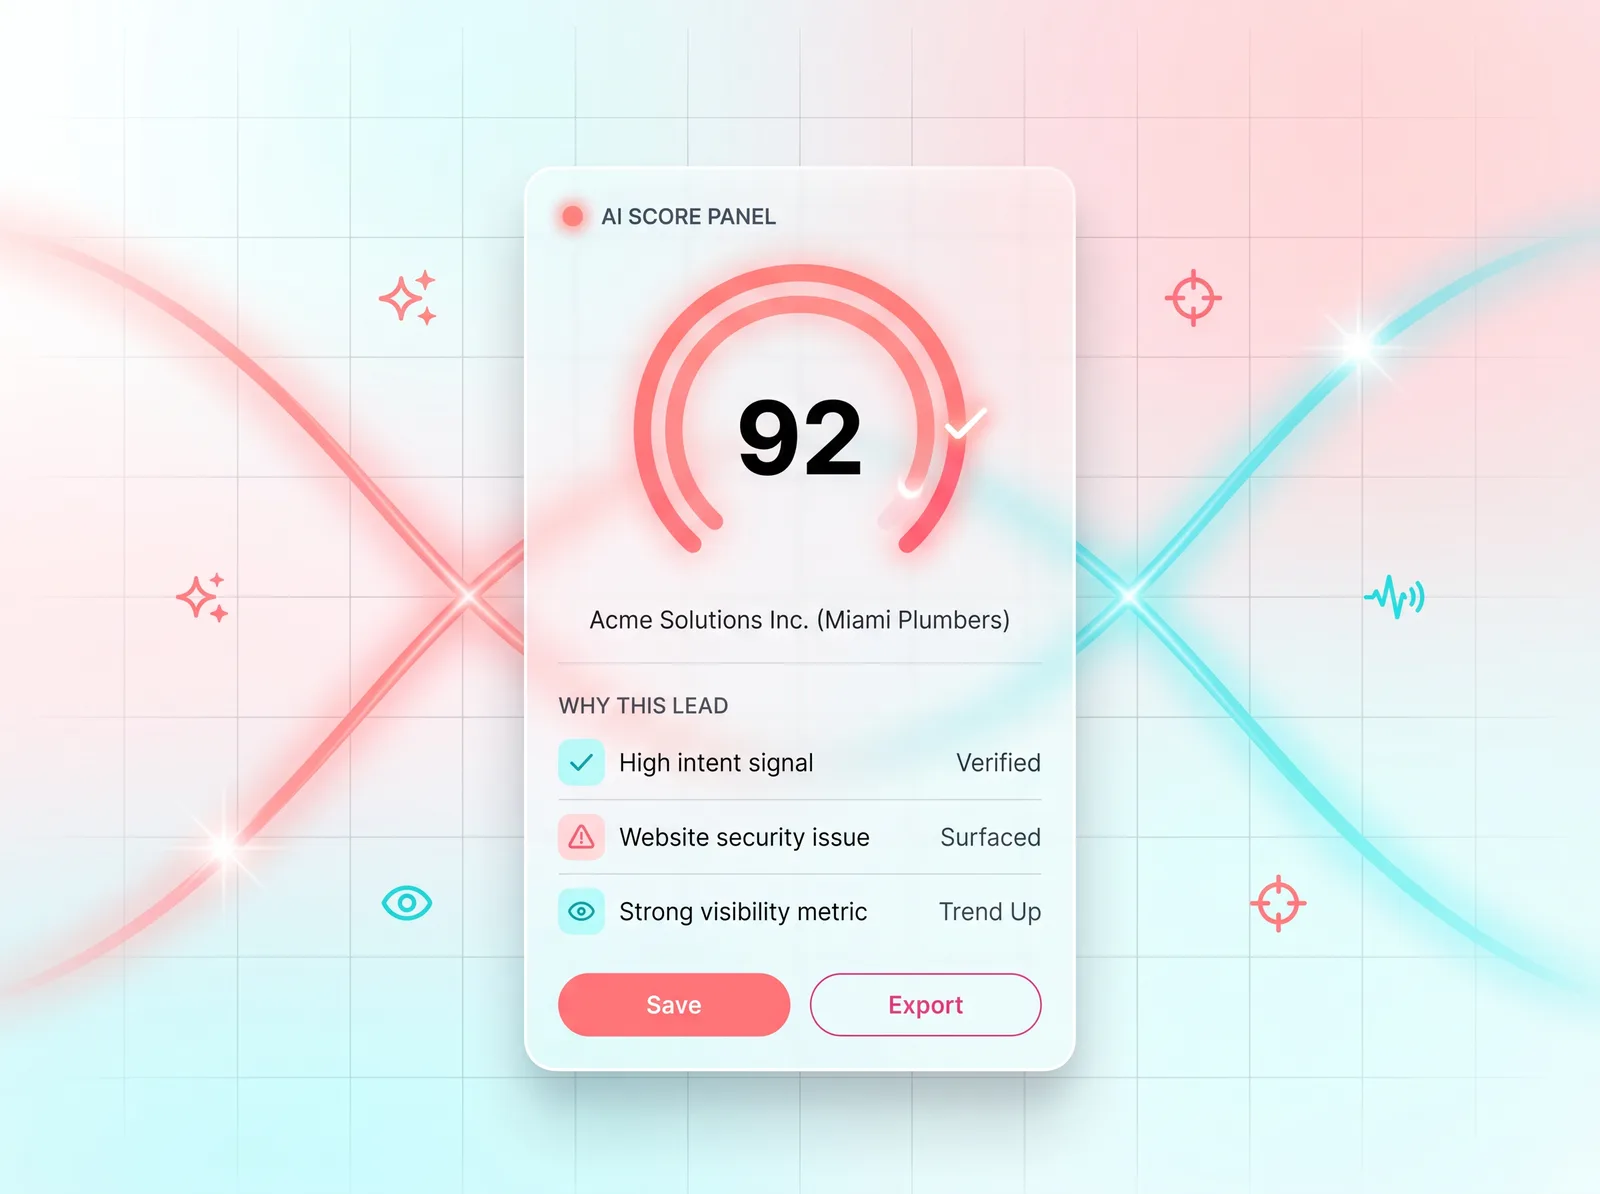
AI Score Panel
Score with plain-language reasoning, signal list, and confidence.
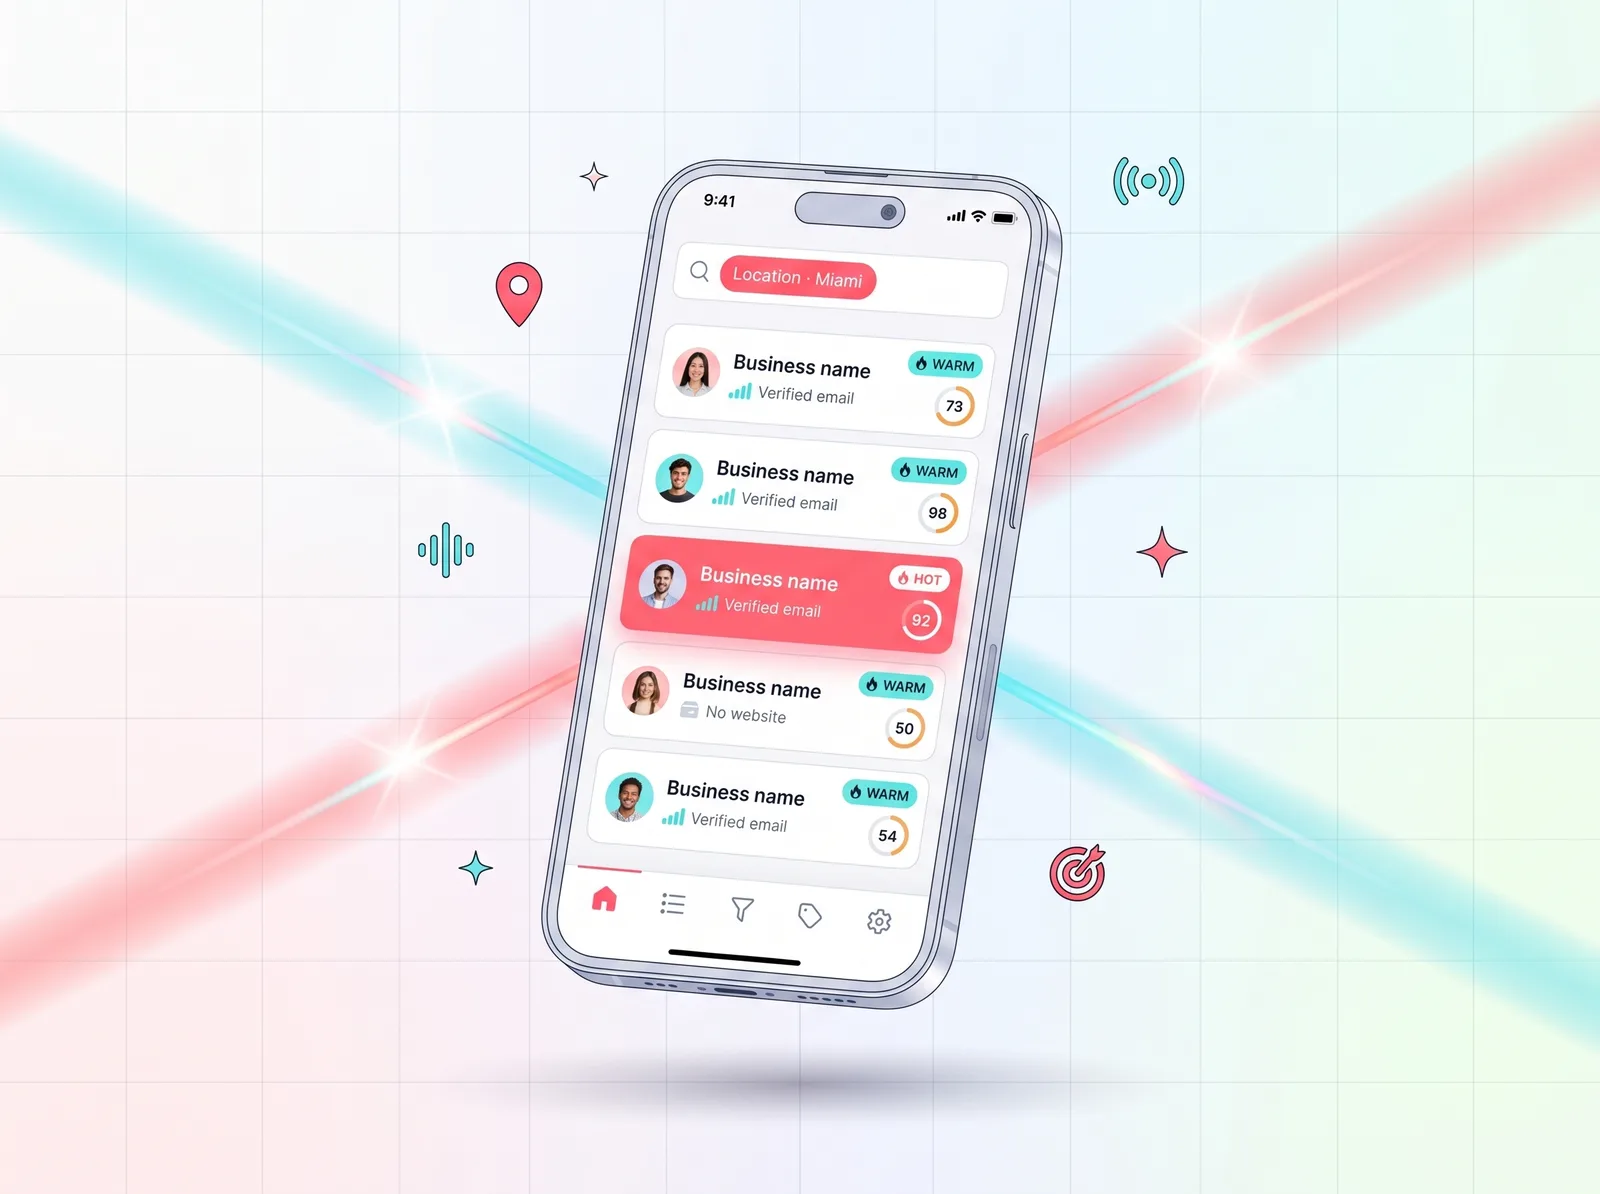
Mobile View
Stacked lead cards with score, signals, and quick actions.
AI design layer
AI was designed to support
Guiding principle
AI should reduce ambiguity, not create blind trust.
Every AI surface in the product had to be paired with an explanation, a signal list, or a clear way to disagree.
AI helps prioritize which leads deserve attention first.
Users should see why a lead was scored highly, not just receive a number.
AI can recommend next actions, outreach angles, and CRM notes.
“The goal was not to make AI feel magical. The goal was to make decision-making feel faster and clearer.”
Design decisions
Users see high-level score, location, and opportunity signals before deeper data.
AI reasoning is shown in plain language to build trust.
Users can inspect leads without losing the results list or map context.
Filters are based on how users qualify leads, not just database fields.
When data is incomplete or an API source fails, the UI should communicate that clearly.
Every screen should help the user move toward save, export, outreach, or decision.
Before and after
Before
After
Relevance to complex data products
LeadRx is not just a lead generation interface. It is a design system for turning noisy data into structured decisions. That same product design challenge applies to any industry where users need to understand complex information quickly, trust the system, and take action.
This type of workflow thinking is especially relevant for products that rely on

Reflection
The biggest lesson from LeadRx is that AI is most valuable when it improves the user’s decision path. A product should not simply generate more information. It should help users understand what changed, why it matters, how confident the system is, and what they should do next.
AI should accelerate workflow, not replace judgment.
Trust comes from clarity, explainability, and transparent system states.
The best dashboards turn complexity into confident action.
Designed for complexity
LeadRx Insights represents the kind of product design work I enjoy most: complex systems, AI-assisted workflows, strong visual hierarchy, and interfaces that help users make better decisions faster.